1841220388zzzcccxxx-star/dsh-token-stats
DeepSeek Harness 的令牌使用与成本统计插件——按模型/日期/会话统计,成本估算(美元/人民币),CSV/JSON 导出 | DeepSeek Harness 令牌用量统计插件:按模型/日期/会话统计用量与费用,支持 CSV/JSON 导出
项目介绍Project Overview
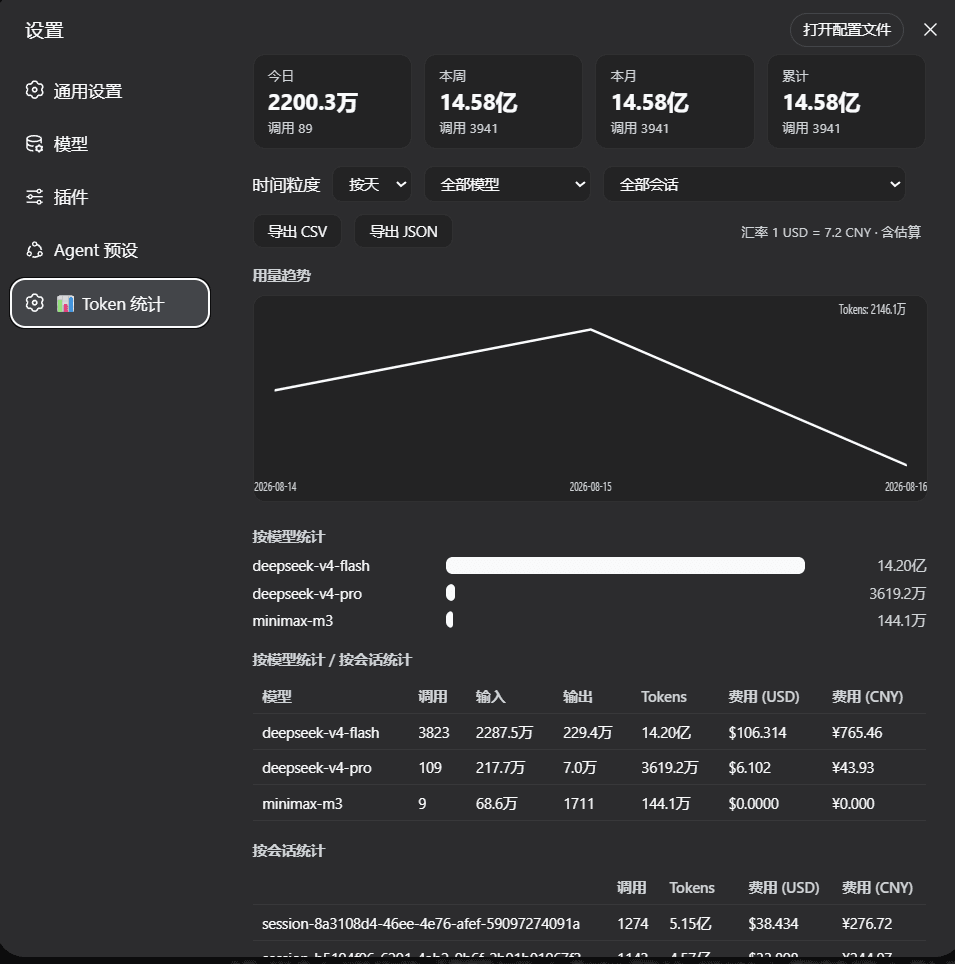
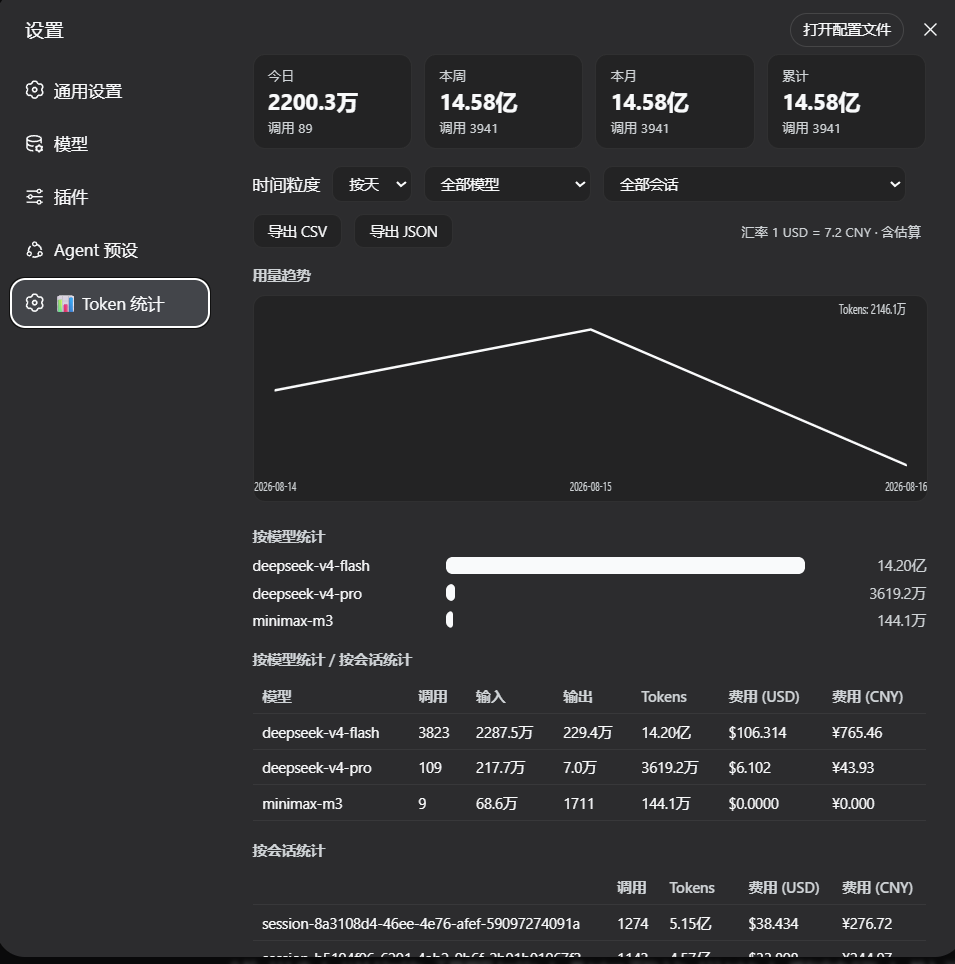
dsh-token-stats 是 DeepSeek Harness 的外部插件,提供 Token 用量与费用统计。它在启动时回填历史会话日志,按模型、日期、会话聚合输入、输出、缓存读写及推理 Token,并依据内置定价表估算 USD / CNY 成本。原生页面位于「设置 → 📊 Token Stats」,支持日/周/月趋势 SVG 折线图、CSV/JSON 导出及模型/会话筛选。适用于需要追踪 API 消耗与成本核算的场景。需注意:缺失 usage 的记录会用 tokenMeter 估算并标记为 estimated。
dsh-token-stats is an external plugin for DeepSeek Harness that tracks token usage and estimated cost. On startup it backfills all persisted session logs and aggregates input, output, cache-read, cache-write, and reasoning tokens by model, date, and session, computing USD and CNY cost via a built-in pricing table for DeepSeek, GPT, Claude, Gemini, Qwen, and more. A native page under Settings → 📊 Token Stats provides daily/weekly/monthly SVG trend charts, filters, and CSV/JSON export. Use it to monitor API consumption and spending. Note: records lacking usage are estimated via tokenMeter and flagged as estimated.
请帮我了解并安装插件:【dsh-token-stats】【https://github.com/1841220388zzzcccxxx-star/dsh-token-stats】把上面这条消息直接发给当前会话里的 DSH,让它帮你了解并安装。安装命令不一定准确,发给 DSH 更稳。Send this message to DSH in your current session. CLI install commands may not be accurate across systems — DSH will figure it out for you.
或使用命令行安装(适合开发者)Or use CLI install (for developers)
命令行安装CLI Install
dsh plugin --profile web add github:1841220388zzzcccxxx-star/dsh-token-stats把 1841220388zzzcccxxx-star/dsh-token-stats 加入你的 DSH 配置(web profile)即可启用。
READMEREADME
dsh-token-stats
Token usage & cost statistics plugin for DeepSeek Harness (DSH).
Tracks token consumption per model, per date, and per session with cost estimation in USD / CNY, served as a native page under Settings → 📊 Token Stats. Installed as an external DSH plugin, it loads automatically at DSH startup — no manual activation needed.
Features
- 📊 Native settings page (dark/light aware, follows DSH theme tokens, i18n zh/en)
- 📈 Daily / weekly / monthly trends with an SVG line chart (zero dependencies)
- 💰 Cost estimation (USD & CNY) from a built-in pricing table for DeepSeek, GPT, Claude, Gemini, Qwen…
- 🔁 History backfill: scans all persisted session logs at startup, so stats survive restarts
- ⚡ Fast: batched session-title reads with an in-memory cache (TTL 5 min), single-pass summaries, memoized pricing
- 📤 CSV / JSON export, filterable by model and session
Screenshot
Installation
The plugin is installed as an external DSH profile dependency.
Clone / copy this repository to a local folder, e.g.
D:\dev\dsh-token-statsIn your DSH profile manifest (
~/.dsh/profiles/web/package.json):{ "dependencies": { "dsh-token-stats": "file:D:/dev/dsh-token-stats" }, "dsh": { "profile": { "bundles": ["@deepseek-ai/dsh-base", "@deepseek-ai/dsh-web-app", "dsh-token-stats"] } } }cd ~/.dsh/profiles/web && pnpm installRestart DSH web. Open Settings → 📊 Token Stats.
cordis.patch.ymldeclares the bundle-layer mount point so the plugin auto-loads at startup.
How it works
- Authoritative data = DSH persisted session logs:
assistant/messageevents carry realusage(input / output / cache-read / cache-write / reasoning tokens),request/headerevents carry provider/model. - A one-shot backfill at startup (
sessionQuery) rebuilds the in-memory aggregation index from all history (bounded concurrency). llm/streamusage chunks are captured for live (display-only) in-flight totals.- When an adapter reports no usage,
tokenMeter.estimateMessageis used and the record is flaggedestimated.
HTTP API (/token-stats/api)
| op | description |
|---|---|
summary |
today / week / month / total aggregates |
query |
time series (day/week/month) + per-model / per-session aggregates; filters: model, sessionId, from, to |
models |
built-in pricing table (USD per 1M tokens) + USD→CNY rate |
sessions |
session list (id + title) |
export |
CSV / JSON dump (format=csv|json, optional model / sessionId) |
Development
node --check index.js      # server half
node --check client.js     # browser half
node test-plugin.js        # standalone mock tests: correctness + performance benchmarks
.\sync-deploy.ps1          # re-sync sources into the DSH profile (then restart DSH web)
Performance
Measured on the author's machine (14 sessions / ~10k records):
| endpoint | before | after |
|---|---|---|
sessions |
~1700 ms (N serial readTitle calls) |
~12 ms (one batched readTitleSnapshots + cache) |
summary |
~110 ms (4× full-array filters) | <1 ms (single pass) |
query |
~10 ms | ~18 ms at 10k records (memoized cost) |
License
MIT © 2026 quansheng
相关推荐Related
-
 nexu-io/open-design
🎨 Best DeepSeek Harness Design Plugin. The open-source Claude Design alternative. 🖥️ Local-first desktop app. 🖼️ Your…
nexu-io/open-design
🎨 Best DeepSeek Harness Design Plugin. The open-source Claude Design alternative. 🖥️ Local-first desktop app. 🖼️ Your…
-
 ruvnet/ruflo
🌊 The original agent meta-harness. Deploy intelligent multi-player swarms, coordinate autonomous workflows, and build c…
ruvnet/ruflo
🌊 The original agent meta-harness. Deploy intelligent multi-player swarms, coordinate autonomous workflows, and build c…
-
 amruthpillai/reactive-resume
A one-of-a-kind resume builder that keeps your privacy in mind. Completely secure, customizable, portable, open-source a…
amruthpillai/reactive-resume
A one-of-a-kind resume builder that keeps your privacy in mind. Completely secure, customizable, portable, open-source a…
-
 esengine/DeepSeek-Reasonix
DeepSeek-native AI coding agent for your terminal. Engineered around prefix-cache stability — leave it running.
esengine/DeepSeek-Reasonix
DeepSeek-native AI coding agent for your terminal. Engineered around prefix-cache stability — leave it running.
-
 volcengine/OpenViking
Self-evolving Context Database for AI Agents. Unify Agent Memory, Knowledge RAG and Skills.
volcengine/OpenViking
Self-evolving Context Database for AI Agents. Unify Agent Memory, Knowledge RAG and Skills.
-
 Molunerfinn/PicGo
:rocket: The Ultimate Image Uploader for Efficient Creators. Supports Obsidian, Typora, VS Code etc. and 60+ image hosti…
Molunerfinn/PicGo
:rocket: The Ultimate Image Uploader for Efficient Creators. Supports Obsidian, Typora, VS Code etc. and 60+ image hosti…
-
 titanwings/distilly
Distilly — Distill how they think into reusable Skills for any Agent or Bot. Formerly Colleague Skill(原同事 Skill).
titanwings/distilly
Distilly — Distill how they think into reusable Skills for any Agent or Bot. Formerly Colleague Skill(原同事 Skill).
-
 titanwings/colleague-skill