1HelloMan1/dsh-usage-dashboard-plus
DeepSeek Harness 使用仪表板,包含 API 余额、每日支出、外部视觉调用核算、按模型统计、调用日志、缓存率、TTFT 及 CSV 导出。
项目介绍Project Overview
dsh-usage-dashboard-plus 是一款用于 DeepSeek Harness (dsh) 的侧边栏底部小部件,实时显示 DeepSeek API 余额与今日预估消费。它新增外部视觉模型(如 mimo-v2.5)调用统计功能,通过可选 JSONL 日志与内置定价表纳入今日开销,并提供按会话、模型、用量及 CSV 导出的全量调用分析。适合需要监控 dsh web 账户余额与当日花费、且配合 dsh-vision-fallback 等外部模型调用的用户。注意事项:不要与已弃用的 dsh-stats-dashboard 同时启用,且修改配置后需重启 dsh web,因 profile patch 层不支持热加载。
dsh-usage-dashboard-plus is a sidebar-footer widget for DeepSeek Harness (dsh) that surfaces your DeepSeek API balance and today's estimated spend. It extends the base dashboard by counting external vision-model calls (e.g. mimo-v2.5 from dsh-vision-fallback) via an optional JSONL log, bundles built-in pricing, and provides per-session/per-model analytics with CSV export. Use it when you need live balance and daily cost visibility in the dsh web UI alongside external model plugins. Caveat: do not enable alongside the legacy dsh-stats-dashboard, and restart dsh web after changes since the profile patch layer is not hot-reloaded.
请帮我了解并安装插件:【dsh-usage-dashboard-plus】【https://github.com/1HelloMan1/dsh-usage-dashboard-plus】把上面这条消息直接发给当前会话里的 DSH,让它帮你了解并安装。安装命令不一定准确,发给 DSH 更稳。Send this message to DSH in your current session. CLI install commands may not be accurate across systems — DSH will figure it out for you.
或使用命令行安装(适合开发者)Or use CLI install (for developers)
命令行安装CLI Install
dsh plugin --profile web add dsh-usage-dashboard-plus把 1HelloMan1/dsh-usage-dashboard-plus 加入你的 DSH 配置(web profile)即可启用。
READMEREADME
dsh-usage-dashboard-plus
A fork of dsh-usage-dashboard with external vision-call accounting: a sidebar-footer widget for DeepSeek Harness (dsh) showing your DeepSeek API balance and today's spend, estimated from session logs.
This is now the only actively maintained usage-dashboard repository. The former dsh-stats-dashboard implementation has been fully merged into Plus; do not install both statistics plugins in the same profile.
What "Plus" adds
- Counts external vision-model calls (e.g.
dsh-vision-fallback's Mimo V2.5 requests) into the today-spend stats via an optional JSONL usage log — the base package only counts calls recorded in DSH session logs. - Bundles a pricing entry for
mimo-v2.5(opencode Zen GO rates) so those calls get a cost estimate out of the box (override viaprices).
Features
- API balance — resolves the DeepSeek key through the DSH credentials service and queries the balance endpoint (cached).
- Today's spend (est.) — scans session logs (and the external usage log) for today's token usage × price table.
- Sidebar footer widget —
余额 ¥xx · 今日 ¥xx, click to open a detail card (calls, tokens, per-model breakdown, pricing notes). - Peak/off-peak pricing schedule — date-gated DeepSeek rate tables (2026-08-17 onward).
- Full usage dashboard — per-provider/per-model calls, latency, TTFT, throughput, input/output/cache tokens, cache rate, and estimated cost.
- Call-log analysis — filter and search by session, provider, and model; inspect recent calls and export filtered rows as CSV.
- Inherited Stats implementation — the
usageDashboardsession projection, 500-row call-log cap, whole-session model aggregates, and replay-safe historical statistics are included in Plus. - No build step — host half (
lib/index.js) + browser bundle (lib/client.js) via thedsh.clientmechanism.
Migrating from dsh-stats-dashboard
- Remove or disable the old
dsh-stats-dashboardplugin from thewebprofile. - Install
dsh-usage-dashboard-plus. - Restart
dsh weband hard-refresh the Settings page.
Plus reads the existing session logs, so historical sessions do not need to be migrated. Do not keep both statistics plugins enabled; the old repository is retained only as a historical source and is no longer maintained independently.
Install
dsh plugin --profile web add dsh-usage-dashboard-plus
# restart `dsh web` — the profile patch layer is not hot-reloaded
The npm package ships dsh.bundle and cordis.patch.yml, so the install command inserts usage-dashboard into the target profile without manual directory copies or patch editing.
Verify:
dsh --profile web --dump-config # expect a usage-dashboard-plus row
Then hard-refresh the GUI (Cmd+Shift+R) — the footer widget appears next to 设置/Settings.
Configuration
All settings live under the usage-dashboard namespace in ~/.dsh/settings.yaml (hot-reloaded):
usage-dashboard:
  apiKeyRef: DEEPSEEK_API_KEY      # credential ref for balance queries
  baseURL: ""                      # empty → $DEEPSEEK_BASE_URL → api.deepseek.com
  prices:                          # per-model CNY per 1M tokens (input/cacheRead/output)
    "mimo-v2.5": { input: 2, cacheRead: 0.05, output: 8 }
  priceSchedule: []                # date-gated peak/idle tables
  balanceCacheMs: 60000
  sessionsRoot: ""                 # default <dsh home>/sessions
  scanWindowMs: 172800000          # only scan session logs modified within this window
  externalUsageLog: ""             # JSONL log of external model calls
External usage log (externalUsageLog)
dsh-vision-fallback (and other plugins that call models outside the DSH session-log pipeline) can append one JSON line per external call:
{ "ts": 1755000000000, "model": "mimo-v2.5", "inputTokens": 1200, "outputTokens": 320, "cacheReadTokens": 0, "cacheWriteTokens": 0 }
Default path: <dsh home>/vision-fallback/usage.jsonl. Set externalUsageLog: off to disable.
Development
npm test # validates the npm package, dsh.bundle, and cordis.patch.yml
License
MIT — forked from dsh-usage-dashboard (MIT).
相关推荐Related
-
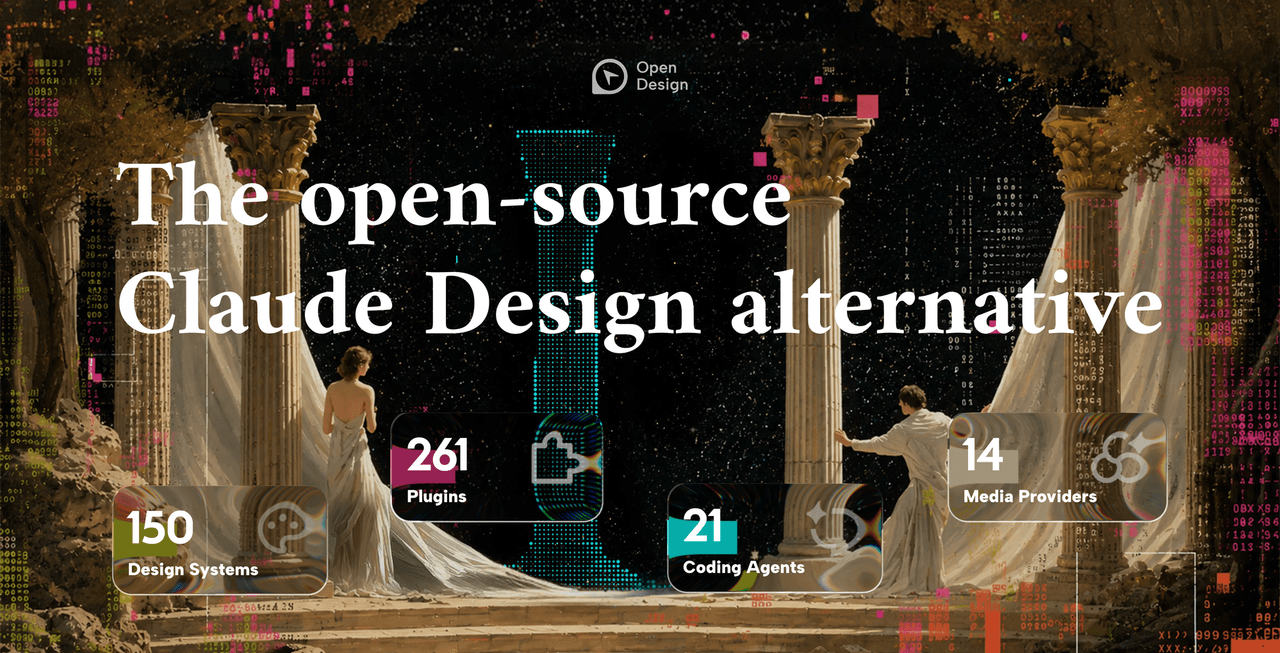 nexu-io/open-design
🎨 Best DeepSeek Harness Design Plugin. The open-source Claude Design alternative. 🖥️ Local-first desktop app. 🖼️ Your…
nexu-io/open-design
🎨 Best DeepSeek Harness Design Plugin. The open-source Claude Design alternative. 🖥️ Local-first desktop app. 🖼️ Your…
-
 ruvnet/ruflo
🌊 The original agent meta-harness. Deploy intelligent multi-player swarms, coordinate autonomous workflows, and build c…
ruvnet/ruflo
🌊 The original agent meta-harness. Deploy intelligent multi-player swarms, coordinate autonomous workflows, and build c…
-
 amruthpillai/reactive-resume
A one-of-a-kind resume builder that keeps your privacy in mind. Completely secure, customizable, portable, open-source a…
amruthpillai/reactive-resume
A one-of-a-kind resume builder that keeps your privacy in mind. Completely secure, customizable, portable, open-source a…
-
 volcengine/OpenViking
Self-evolving Context Database for AI Agents. Unify Agent Memory, Knowledge RAG and Skills.
volcengine/OpenViking
Self-evolving Context Database for AI Agents. Unify Agent Memory, Knowledge RAG and Skills.
-
 Molunerfinn/PicGo
:rocket: The Ultimate Image Uploader for Efficient Creators. Supports Obsidian, Typora, VS Code etc. and 60+ image hosti…
Molunerfinn/PicGo
:rocket: The Ultimate Image Uploader for Efficient Creators. Supports Obsidian, Typora, VS Code etc. and 60+ image hosti…
-
 titanwings/colleague-skill
将冰冷的离别化为温暖的 Skill,欢迎加入数字生命1.0!Transforming cold farewells into warm skills? It's giving rebirth era. Welcome to Digital …
titanwings/colleague-skill
将冰冷的离别化为温暖的 Skill,欢迎加入数字生命1.0!Transforming cold farewells into warm skills? It's giving rebirth era. Welcome to Digital …
-
 nocobase/nocobase
NocoBase is an open-source AI + no-code platform for building business systems fast. Instead of generating everything fr…
nocobase/nocobase
NocoBase is an open-source AI + no-code platform for building business systems fast. Instead of generating everything fr…
-
 Tencent/WeKnora
Open-source LLM knowledge platform: turn raw documents into a queryable RAG, an autonomous reasoning agent, and a self-m…
Tencent/WeKnora
Open-source LLM knowledge platform: turn raw documents into a queryable RAG, an autonomous reasoning agent, and a self-m…