apodemakeles/dsh-token-dashboard
DeepSeek Harness(DSH)插件:本地每日/每周令牌使用量仪表板与热力图
项目介绍Project Overview
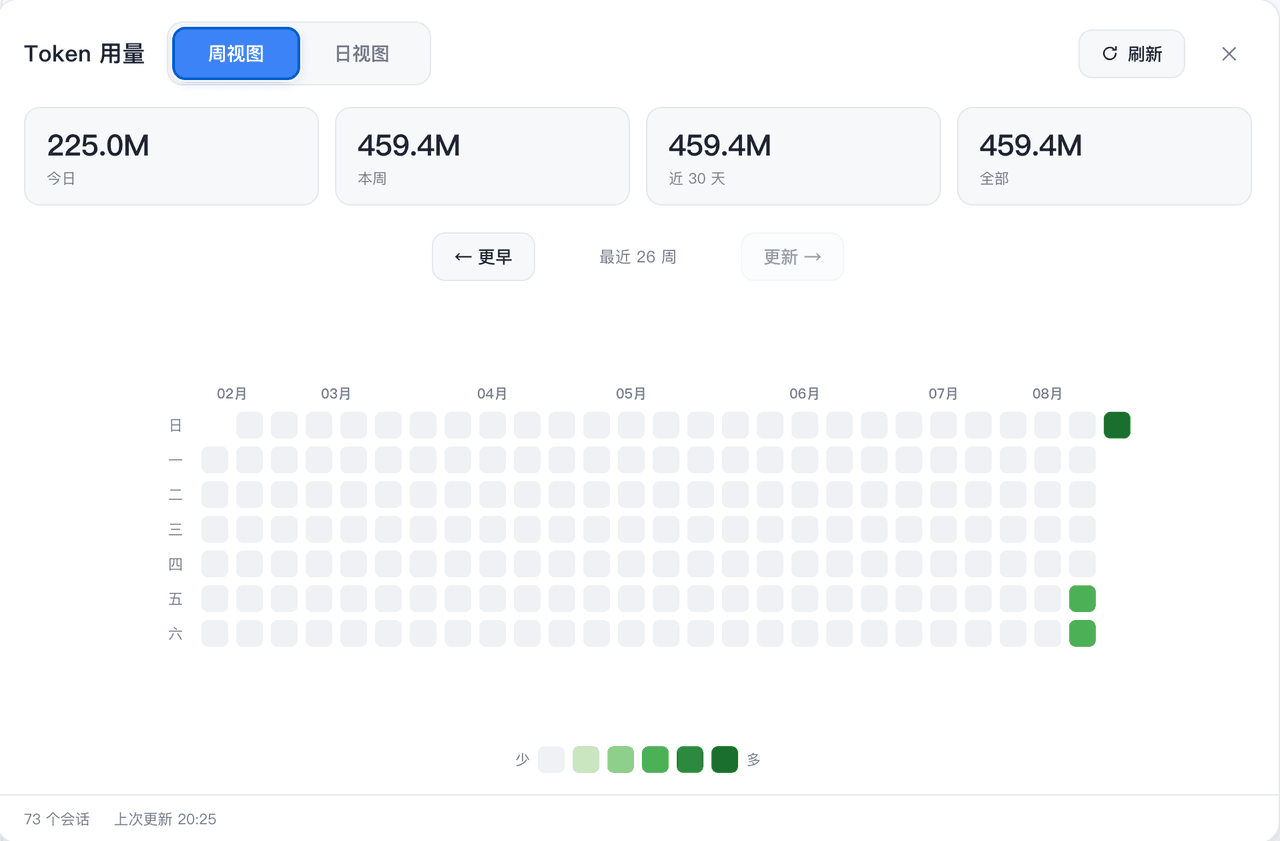
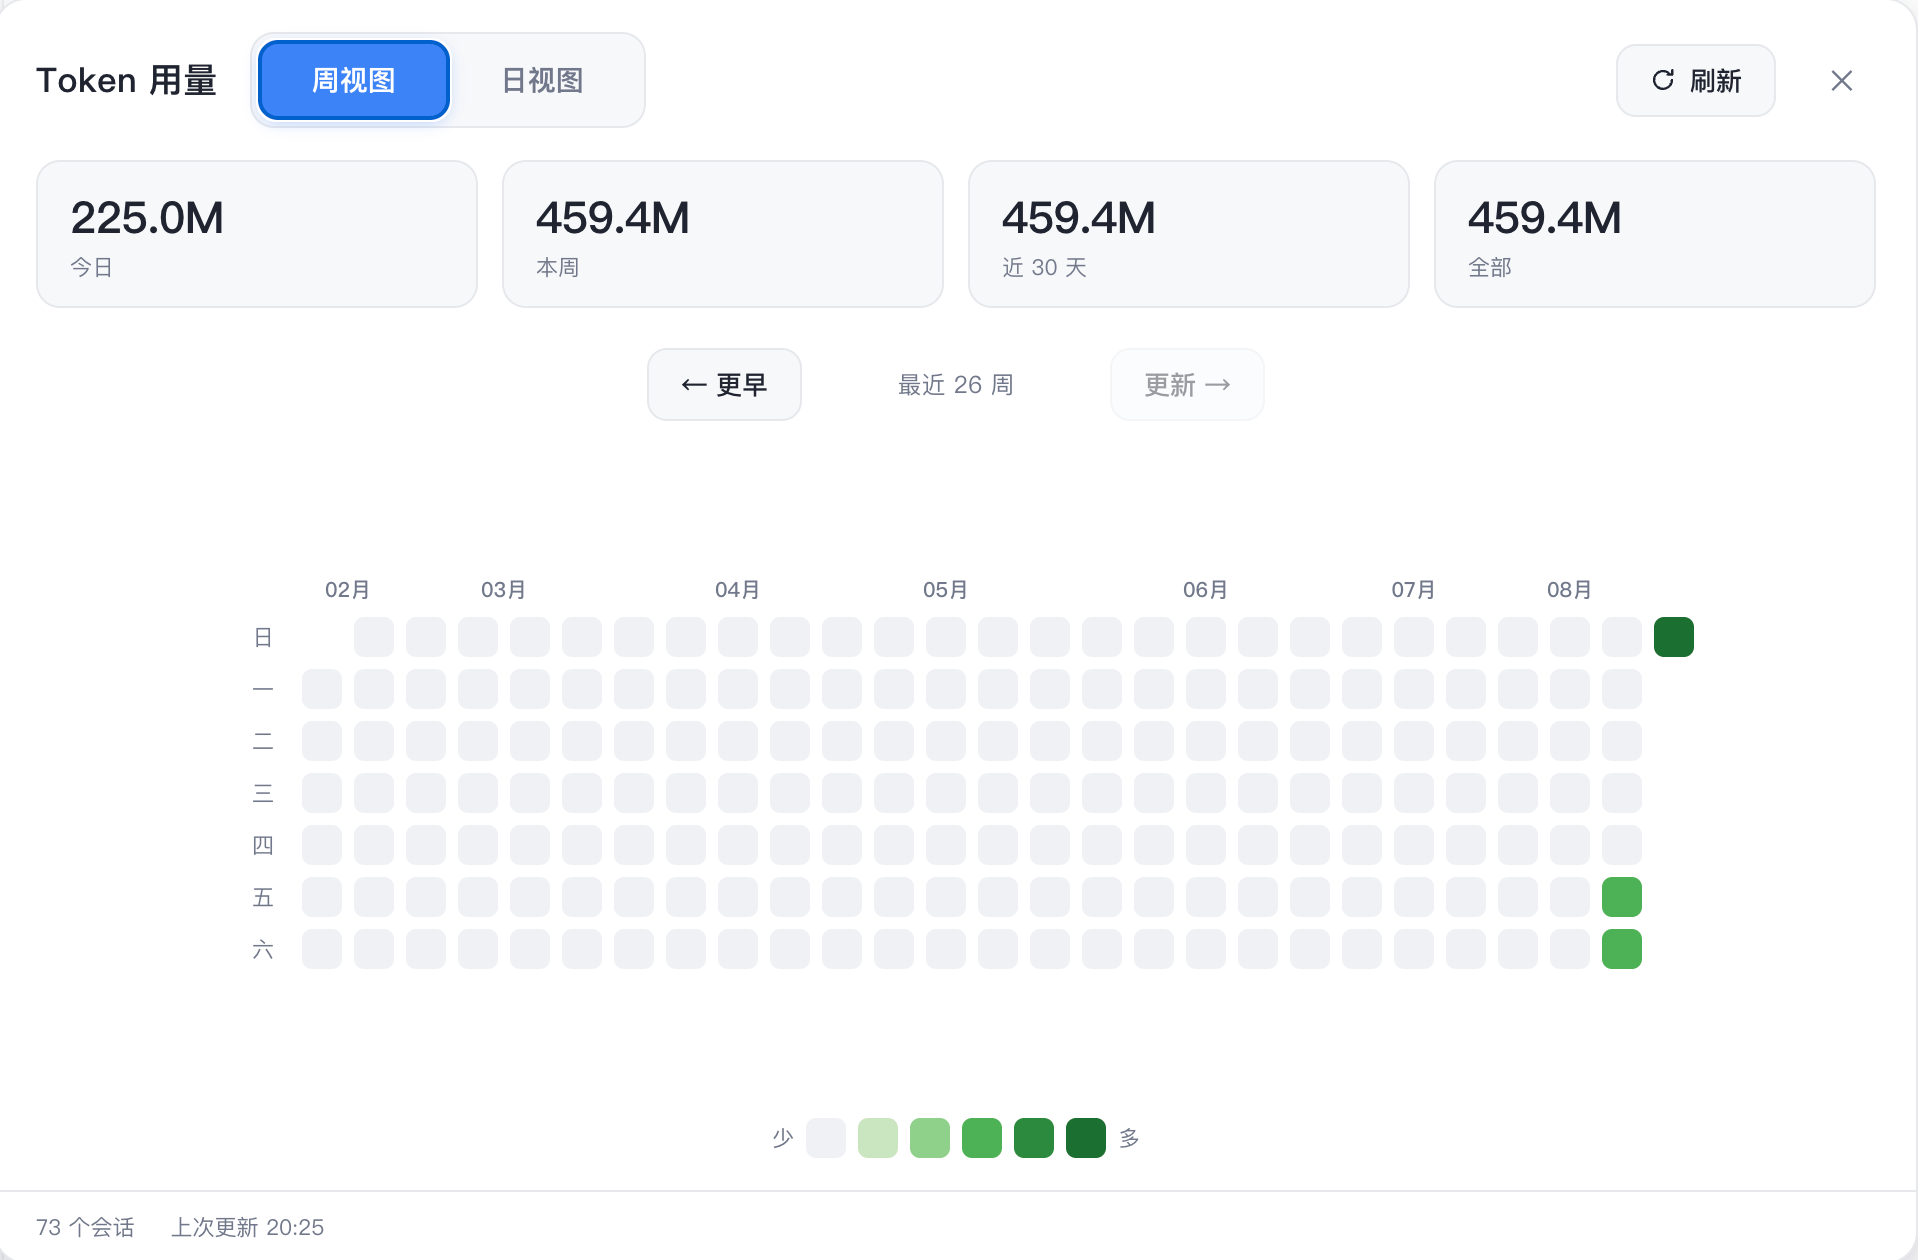
这是 DSH 网页 GUI 插件,提供类 GitHub 贡献图的 Token 消耗热力图。常驻 Worker 监听会话事件并把用量增量原子写入本地 SQLite,面板仅读取快照,展示本机所有项目的每日/每周总 Token。适合需要快速查看用量趋势时使用。注意:投影仅限本机会话,缓存读取计入总量,且依赖 Node 24 实验性 node:sqlite。
A DSH web GUI plugin that adds a Token sidebar panel with a GitHub-style token-usage heatmap. A persistent Worker listens to session events, durably projects minimal usage deltas into local SQLite, and serves one snapshot endpoint; the panel renders daily and weekly totals without scanning logs. Use it to review local token-consumption trends. Caveat: data is machine-local, cache reads count in totals, and it relies on Node 24's experimental node:sqlite.
请帮我了解并安装插件:【dsh-token-dashboard】【https://github.com/apodemakeles/dsh-token-dashboard】把上面这条消息直接发给当前会话里的 DSH,让它帮你了解并安装。安装命令不一定准确,发给 DSH 更稳。Send this message to DSH in your current session. CLI install commands may not be accurate across systems — DSH will figure it out for you.
或使用命令行安装(适合开发者)Or use CLI install (for developers)
命令行安装CLI Install
dsh plugin --profile web add github:apodemakeles/dsh-token-dashboard把 apodemakeles/dsh-token-dashboard 加入你的 DSH 配置(web profile)即可启用。
READMEREADME
@apodemakeles/dsh-token-dashboard
English | 中文
A DeepSeek Harness (DSH) web GUI plugin: a token-consumption heatmap panel. It shows your total token usage per day / per week across all projects on this machine, GitHub-contributions style. Usage facts are projected into a local SQLite database by a persistent Worker, so opening the panel never scans session logs.
Status: released v0.2.0 — GitHub distribution is live. The package is not currently published to npm.
Screenshots
Weekly heatmap
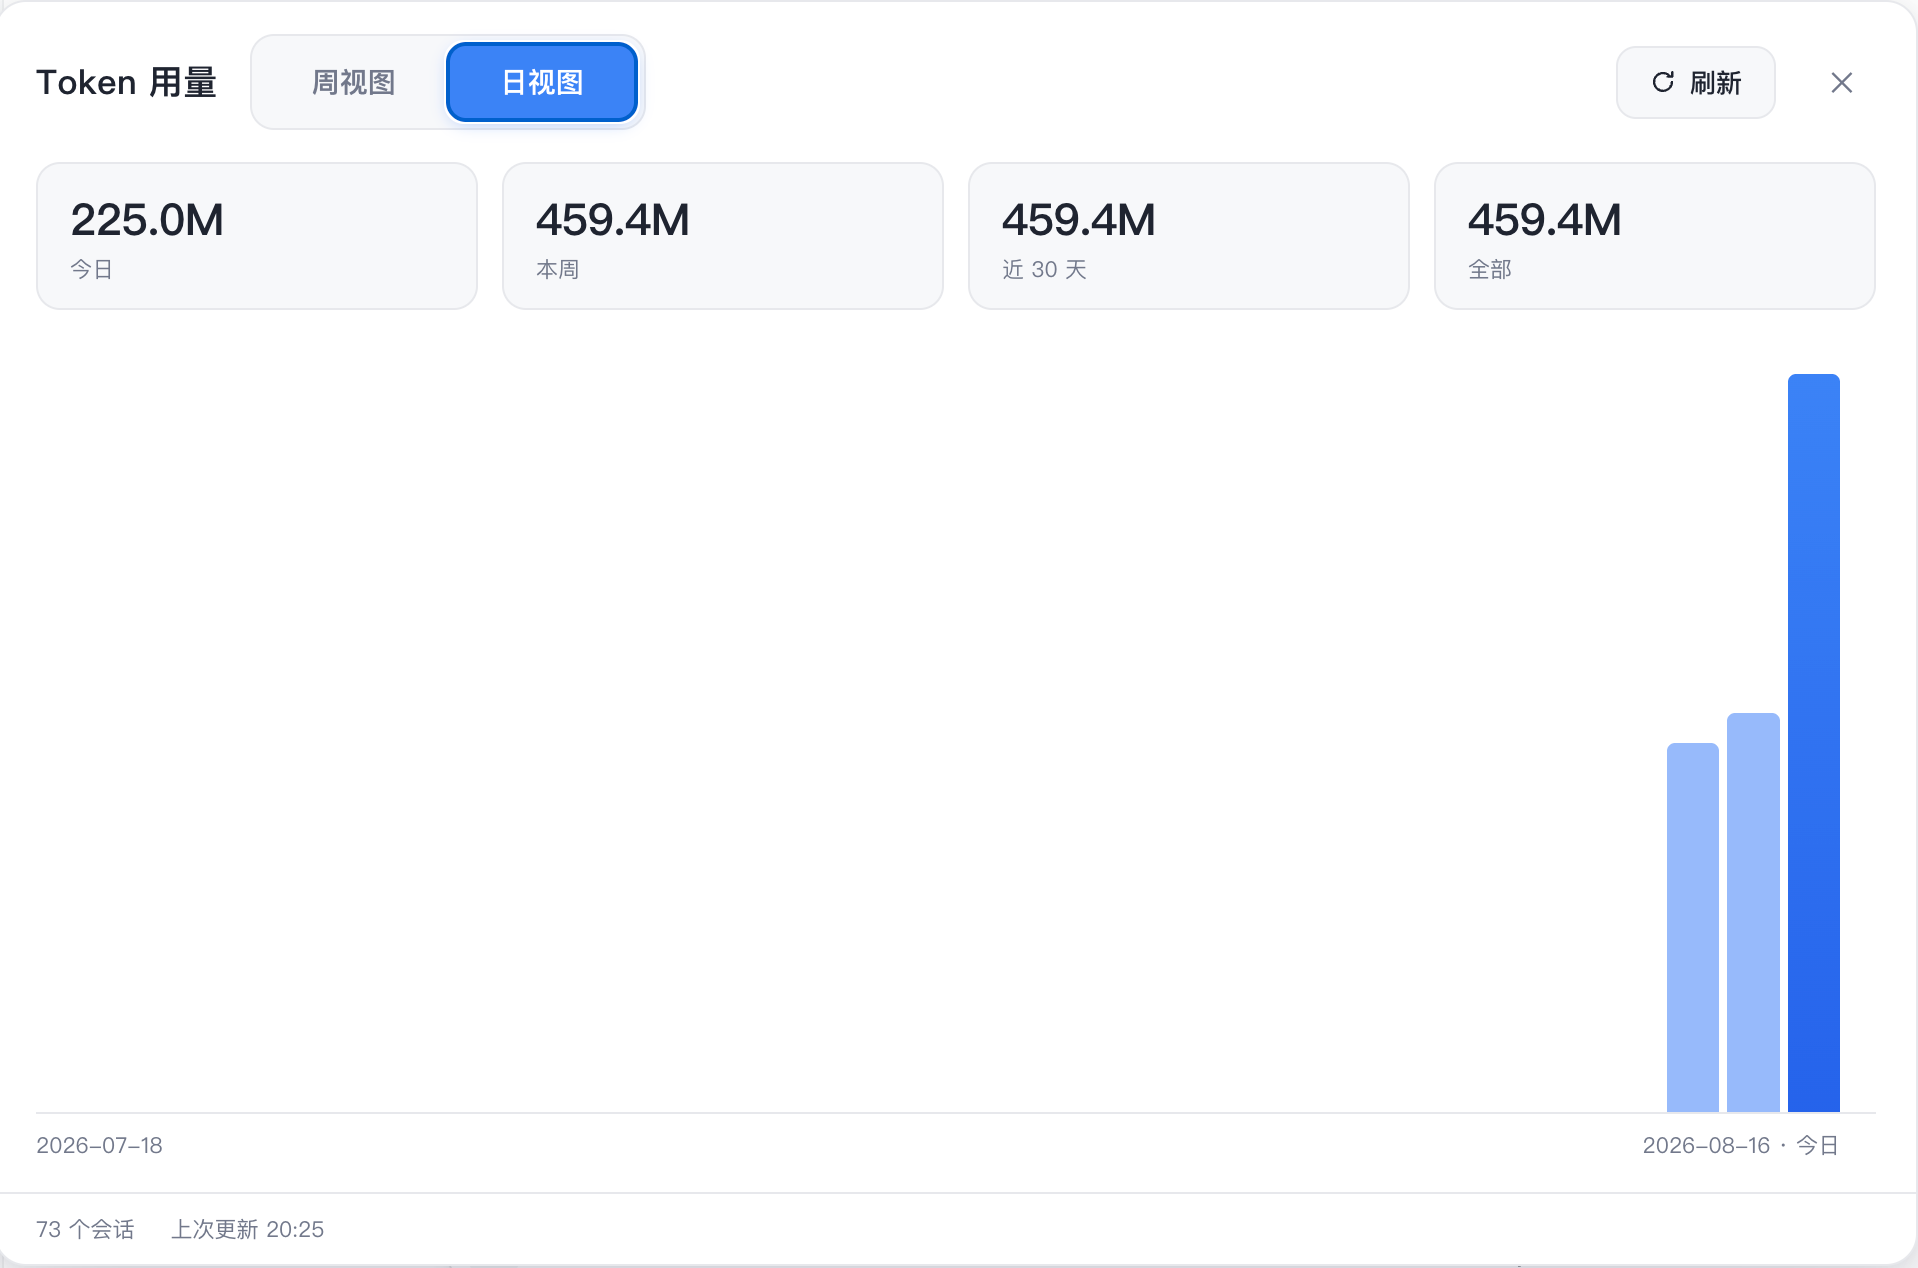
Daily view
What it does
- Host half — listens to live
session/event, flushes through DSH's durability barrier, and sends minimal usage deltas to a persistent Worker. The Worker owns SQLite (node:sqlite), commits facts/checkpoints atomically, and serves one consistent snapshot endpoint. - Client half — registers a Token entry in the sidebar and opens a dedicated panel rendering the heatmap (weekly grid + daily view). It fetches a single
GET /api/token-dashboard/snapshotper open/refresh/page change. - CLI —
dsh-token-dashboard status|verify|rebuild|backups|restore|cleanupfor local maintenance.
Installation
From GitHub:
dsh plugin --profile web add github:apodemakeles/dsh-token-dashboard
Then restart dsh web. Open any project session and click the Token entry in the sidebar.
The npm package is not currently published; use the GitHub installation above.
Data and operations
- Projection database:
$DSH_HOME/data/token-dashboard/usage-v1.sqlite(default~/.dsh). - Total tokens =
inputTokens + outputTokens + cacheReadTokens(cache reads count into the headline). - The panel only calls the snapshot route; it does not trigger
listSnapshots,inspect,readFrom,flush, or backfill. - First startup initializes the database in the background; the panel shows phase/progress until
ready.
Development
git clone https://github.com/apodemakeles/dsh-token-dashboard.git
cd dsh-token-dashboard
pnpm install && pnpm build
dsh plugin --profile web add link:$(pwd)
See .scratch/dsh-token-dashboard/map.md for the project map (planning tracker), docs/durable-usage-architecture.md for the architecture contract, and docs/dev-loop.md for the full dev loop.
Known limitations
- Projection is machine-local: it reads sessions stored on this machine (
~/.dsh/sessionsis the authority; SQLite is a rebuildable projection). - Host/Worker changes require restarting DSH; client HMR does not cover the persistent Worker.
- SQLite is experimental in Node 24 (
node:sqlite); the plugin checks capability at startup and does not hide the warning globally.
License
MIT
相关推荐Related
-
 nexu-io/open-design
🎨 Best DeepSeek Harness Design Plugin. The open-source Claude Design alternative. 🖥️ Local-first desktop app. 🖼️ Your…
nexu-io/open-design
🎨 Best DeepSeek Harness Design Plugin. The open-source Claude Design alternative. 🖥️ Local-first desktop app. 🖼️ Your…
-
 freestylefly/awesome-gpt-image-2
Prompt as Code | GPT-Image2 工业级提示词引擎与模板库,530+ 个案例逆向工程,20+ 套工业级模板,并提炼出Skills,持续更新中
freestylefly/awesome-gpt-image-2
Prompt as Code | GPT-Image2 工业级提示词引擎与模板库,530+ 个案例逆向工程,20+ 套工业级模板,并提炼出Skills,持续更新中
-
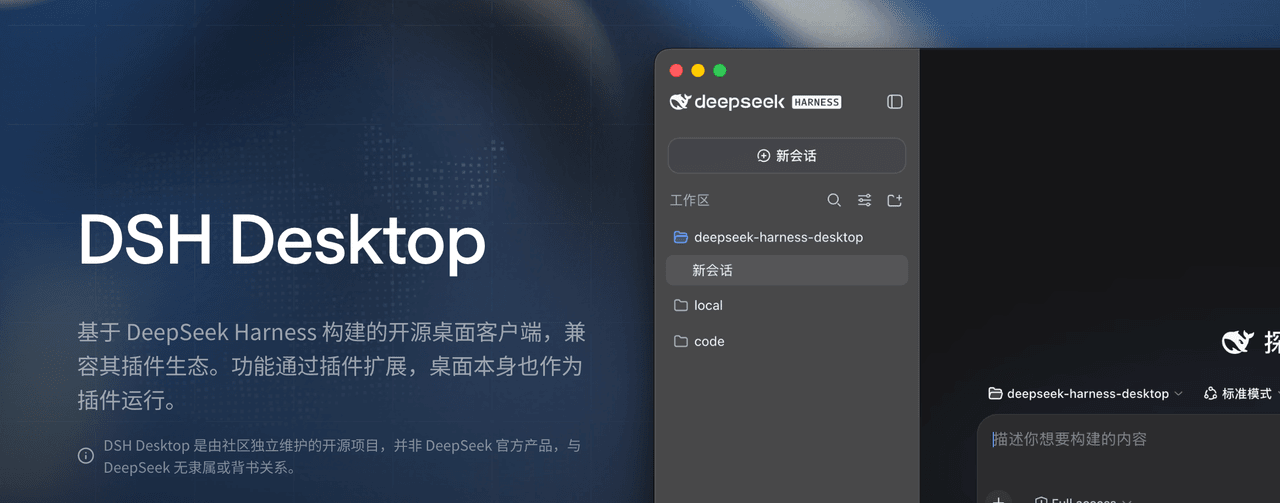 anywhere-labs/dsh-desktop
为 DeepSeek Harness (DSH) 插件生态打造的现代化桌面端解决方案。万物皆「插件」,桌面本身也是「插件」。
anywhere-labs/dsh-desktop
为 DeepSeek Harness (DSH) 插件生态打造的现代化桌面端解决方案。万物皆「插件」,桌面本身也是「插件」。
- Nagi-ovo/voyager Enhancement suite for Gemini, AI Studio, Claude & ChatGPT — plus a prompt manager for any web UI, DeepSeek Harness inclu…
-
 walkinglabs/learn-harness-engineering
Harness engineering beginner tutorial, from 0 to 1
walkinglabs/learn-harness-engineering
Harness engineering beginner tutorial, from 0 to 1
-
 awesome-dsh-plugin/awesome-dsh-plugin
A curated list of plugins for DeepSeek Harness (dsh) · DeepSeek Harness 插件精选列表
awesome-dsh-plugin/awesome-dsh-plugin
A curated list of plugins for DeepSeek Harness (dsh) · DeepSeek Harness 插件精选列表
-
 MemTensor/MemOS
Self-evolving memory OS for LLM & AI Agents: ultra-persistent memory, hybrid-retrieval, and cross-task skill reuse, with…
MemTensor/MemOS
Self-evolving memory OS for LLM & AI Agents: ultra-persistent memory, hybrid-retrieval, and cross-task skill reuse, with…
- yjh051108/dsh-routing-suite dsh-routing-suite — injector + router-standard kit: install the runtime injector first, then the task-aware reasoning-mo…