Auran-Lu/dsh-client-ui-monitor
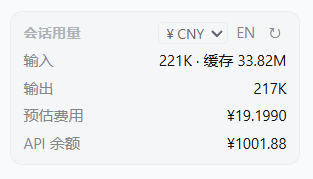
用于监控当前会话额度消耗、预估费用及当前API余额/Used to monitor the current session's quota consumption, estimated costs, and current API balance.
项目介绍Project Overview
DSH Web 插件,在侧边栏左下角固定用量仪表盘。核心能力:实时显示当前会话的 Token 用量(输入含缓存读/写、输出)、按 DeepSeek 公开定价估算费用(CNY/USD),并通过代理查询 API 余额。适用场景:在使用 DeepSeek Harness web 端时需要即时观察消耗与余额。注意事项:默认价格与汇率需根据实际更新;余额查询依赖 DEEPSEEK_API_KEY 凭据。
A DSH web plugin that pins a usage dashboard to the bottom-left of the sidebar. Core capability: it displays the current session's token usage (input with cache read/write, output), estimates cost in CNY or USD using DeepSeek's published pricing, and proxies the API balance endpoint. Use it when running DeepSeek Harness in web mode to track spend and balance in real time. Caveat: pricing and exchange rate constants in lib/client.js are hardcoded and must be updated manually.
请帮我了解并安装插件:【dsh-client-ui-monitor】【https://github.com/Auran-Lu/dsh-client-ui-monitor】把上面这条消息直接发给当前会话里的 DSH,让它帮你了解并安装。安装命令不一定准确,发给 DSH 更稳。Send this message to DSH in your current session. CLI install commands may not be accurate across systems — DSH will figure it out for you.
或使用命令行安装(适合开发者)Or use CLI install (for developers)
命令行安装CLI Install
dsh plugin --profile web add github:Auran-Lu/dsh-client-ui-monitor把 Auran-Lu/dsh-client-ui-monitor 加入你的 DSH 配置(web profile)即可启用。
READMEREADME
@auranlu/dsh-client-ui-monitor
A DeepSeek Harness Web plugin that pins a usage dashboard to the bottom-left of the sidebar.
It shows, live for the current session:
- Token usage — input (with cache read/write), output.
- Estimated cost — computed from DeepSeek's published pricing, displayed in CNY or USD.
- API balance — your DeepSeek account balance, queried via
GET https://api.deepseek.com/user/balance.
Features: Chinese/English toggle, currency selector (CNY/USD), manual balance refresh, auto-refresh every 30s.
Prerequisites
- DeepSeek Harness
webprofile. - A DeepSeek API key configured in Settings → Models (stored as the
DEEPSEEK_API_KEYcredential).
Install
Method 1 — GitHub
dsh plugin --profile web add github:Auran-Lu/dsh-client-ui-monitor
After installing, register the plugin and restart:
Edit ~/.dsh/profiles/web/cordis.patch.yml and add this entry to its top-level array:
- insert:
    - id: ui-monitor
      name: '@auranlu/dsh-client-ui-monitor'
Then restart the server (dsh web) and expand the left sidebar.
Method 2 — one-sentence install (paste to an LLM agent)
Copy the whole block below to a coding agent that has shell access to the machine:
Install the DeepSeek Harness client plugin from github.com/Auran-Lu/dsh-client-ui-monitor: run
dsh plugin --profile web add github:Auran-Lu/dsh-client-ui-monitor, then append this entry to the top-level array of~/.dsh/profiles/web/cordis.patch.yml:- insert: - id: ui-monitor name: '@auranlu/dsh-client-ui-monitor'Finally restart the
dsh webserver and confirm the dashboard appears at the bottom of the left sidebar.
Configuration
Edit lib/client.js before installing / publishing:
| Constant | Default | Meaning |
|---|---|---|
PRICING.inputPerM |
0.27 |
USD per 1M prompt tokens (cache miss) |
PRICING.cacheReadPerM |
0.07 |
USD per 1M prompt tokens (cache hit) |
PRICING.cacheWritePerM |
0.07 |
USD per 1M prompt tokens (cache write) |
PRICING.outputPerM |
1.10 |
USD per 1M completion tokens |
USD_TO_CNY |
7.2 |
USD → CNY exchange rate |
How it works
- Client half (
lib/client.js) registers a component into thesidebar.footer.actionslot and reads the current session'stokenUsageprojection. - Host half (
lib/index.js) registersGET /api/deepseek-balance, proxying DeepSeek's balance API with the stored key.
License
MIT
相关推荐Related
-
 ruvnet/ruflo
🌊 The original agent meta-harness. Deploy intelligent multi-player swarms, coordinate autonomous workflows, and build c…
ruvnet/ruflo
🌊 The original agent meta-harness. Deploy intelligent multi-player swarms, coordinate autonomous workflows, and build c…
-
 amruthpillai/reactive-resume
A one-of-a-kind resume builder that keeps your privacy in mind. Completely secure, customizable, portable, open-source a…
amruthpillai/reactive-resume
A one-of-a-kind resume builder that keeps your privacy in mind. Completely secure, customizable, portable, open-source a…
-
 volcengine/OpenViking
Self-evolving Context Database for AI Agents. Unify Agent Memory, Knowledge RAG and Skills.
volcengine/OpenViking
Self-evolving Context Database for AI Agents. Unify Agent Memory, Knowledge RAG and Skills.
-
 Molunerfinn/PicGo
:rocket: The Ultimate Image Uploader for Efficient Creators. Supports Obsidian, Typora, VS Code etc. and 60+ image hosti…
Molunerfinn/PicGo
:rocket: The Ultimate Image Uploader for Efficient Creators. Supports Obsidian, Typora, VS Code etc. and 60+ image hosti…
-
 titanwings/colleague-skill
将冰冷的离别化为温暖的 Skill,欢迎加入数字生命1.0!Transforming cold farewells into warm skills? It's giving rebirth era. Welcome to Digital …
titanwings/colleague-skill
将冰冷的离别化为温暖的 Skill,欢迎加入数字生命1.0!Transforming cold farewells into warm skills? It's giving rebirth era. Welcome to Digital …
-
 nocobase/nocobase
NocoBase is an open-source AI + no-code platform for building business systems fast. Instead of generating everything fr…
nocobase/nocobase
NocoBase is an open-source AI + no-code platform for building business systems fast. Instead of generating everything fr…
-
 Tencent/WeKnora
Open-source LLM knowledge platform: turn raw documents into a queryable RAG, an autonomous reasoning agent, and a self-m…
Tencent/WeKnora
Open-source LLM knowledge platform: turn raw documents into a queryable RAG, an autonomous reasoning agent, and a self-m…
- Nagi-ovo/voyager Enhancement suite for Gemini, AI Studio, Claude & ChatGPT — plus a prompt manager for any web UI, DeepSeek Harness inclu…