
Chenmo0414/tukey
Turn your coding agent into a data analyst — DuckDB engine, auto-profiling, read-only SQL, and Vega-Lite charts rendered inside the conversation. A DeepSeek Harness plugin + an MCP server for Claude Code / Codex / Cursor. 图基:把编码 Agent 变成数据分析师
项目介绍Project Overview
Tukey 是在编码代理内做数据分析的 DSH 插件,可挂载 CSV、Parquet、JSON、XLSX 或只读 Postgres/MySQL/SQLite,自动剖析数据、用只读 SQL 查询,并在对话中生成 Vega-Lite/ECharts 图表与 HTML 报告。适合探索数据、统计缺失与异常、可视化分析时使用。注意:文件路径暂无工作区围栏,XLSX 依赖 DuckDB 扩展且未覆盖测试。
Tukey is a DSH plugin for data analysis inside a coding agent. It attaches CSV, Parquet, JSON, XLSX, or read-only Postgres/MySQL/SQLite sources, profiles data, runs read-only SQL, and renders Vega-Lite/ECharts charts plus HTML reports in the conversation. Use it for exploratory analysis, data-quality checks, SQL questions, and visual summaries. Caveat: file access has no workspace fencing yet, and XLSX relies on a DuckDB extension without test coverage.
请帮我了解并安装插件:【tukey】【https://github.com/Chenmo0414/tukey】把上面这条消息直接发给当前会话里的 DSH,让它帮你了解并安装。安装命令不一定准确,发给 DSH 更稳。Send this message to DSH in your current session. CLI install commands may not be accurate across systems — DSH will figure it out for you.
或使用命令行安装(适合开发者)Or use CLI install (for developers)
命令行安装CLI Install
dsh plugin --profile web add tukey把 Chenmo0414/tukey 加入你的 DSH 配置(web profile)即可启用。
READMEREADME

Tukey
The open-source Julius AI alternative — inside your coding agent.
Attach a CSV or a Postgres database. Tukey profiles it, answers in SQL, and draws real charts in the conversation.
Named for John Tukey, who invented exploratory data analysis, the box plot, and the 1.5×IQR outlier rule this profiler runs.




English · 中文
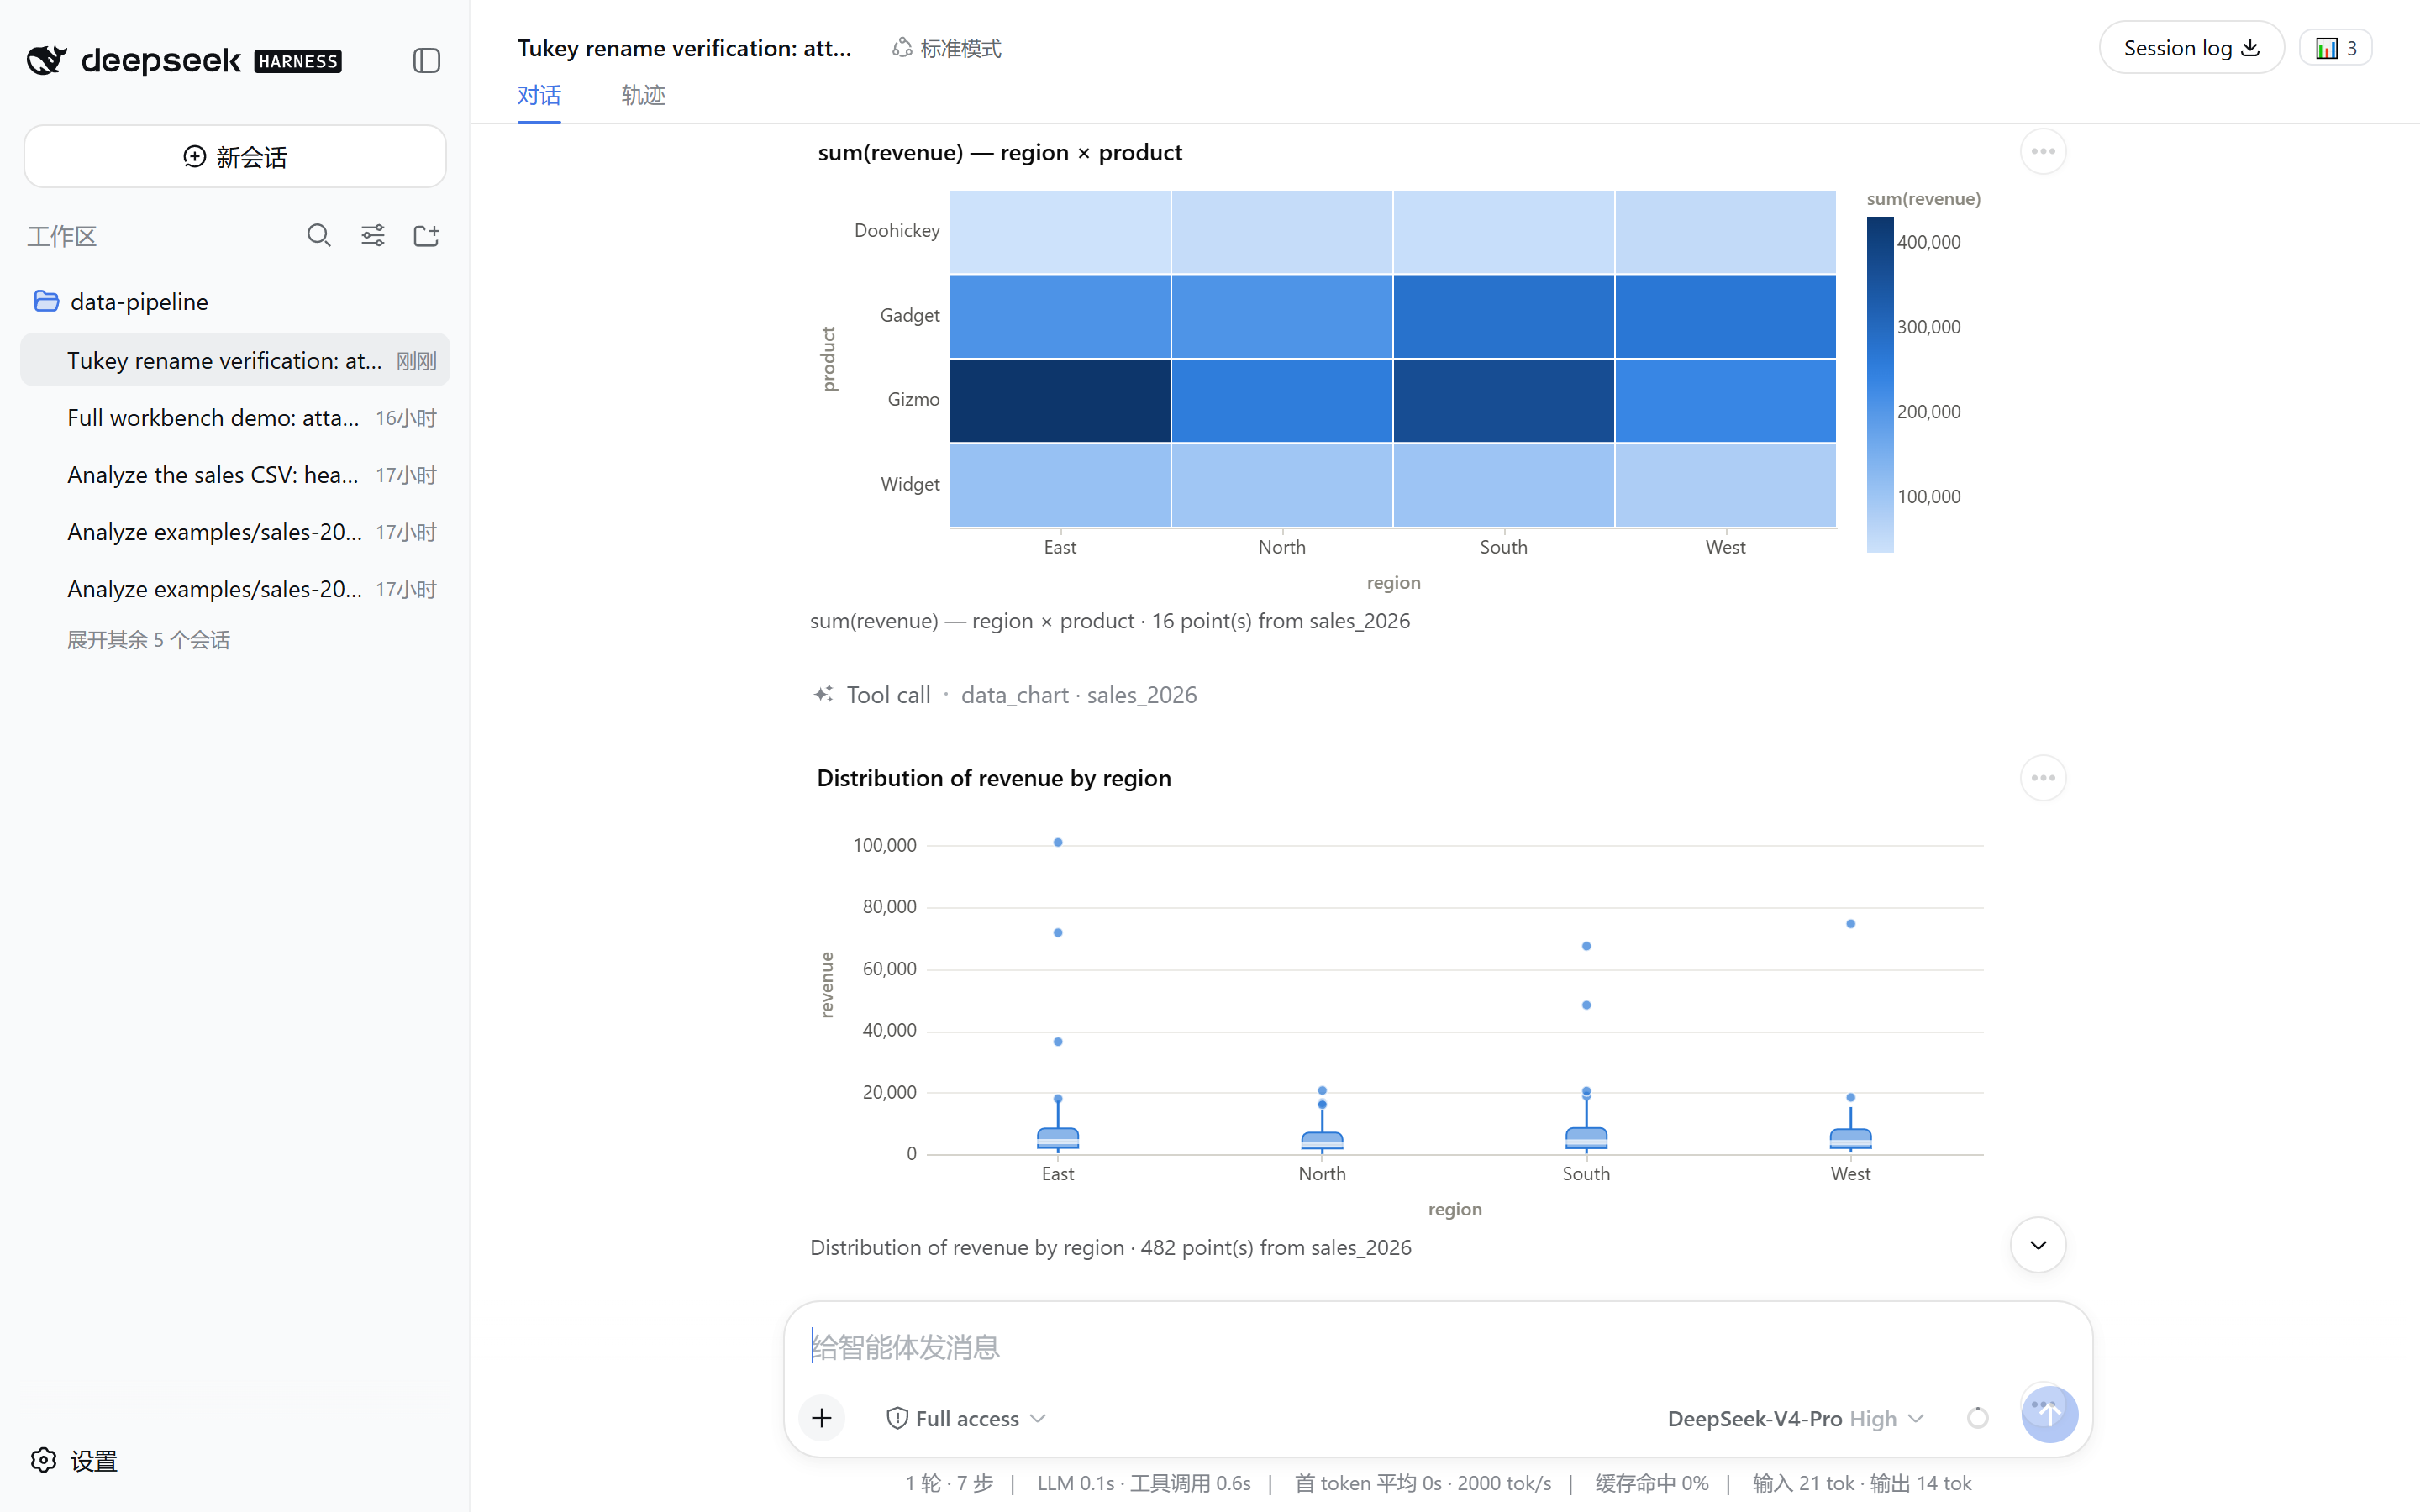
A real DeepSeek Harness session — the agent attached a CSV, profiled it, and drew these charts as conversation nodes (headless-Chrome capture of the live UI; see the verification record):
Status: M1 + M2 + M3 complete. The dsh plugin is live-verified inside
dsh web 0.1.0-rc.8— the full attach → profile → query → chart chain ran in a real session and both charts rendered as conversation nodes (verification record). The MCP server passes protocol-level tests plus a stdio smoke. See Known limitations.
What it does
data_attach     →  register a CSV / Parquet / JSON / XLSX file as a queryable table
data_attach_db  →  attach PostgreSQL / MySQL / SQLite read-only and list its tables
data_profile    →  types, missing values, exact distinct counts, outliers, quality issues, chart ideas
data_query      →  one read-only SQL statement, results as lossless JSON
data_chart      →  bar / line / scatter / histogram / area / heatmap / boxplot (Vega-Lite,
                   interactive) + sankey / sunburst / treemap / gauge (ECharts) — with color
                   series, stacked/grouped layout, facet small multiples; line & scatter pan/zoom
data_report     →  a self-contained HTML report (profile + charts as inline SVG); prints to PDF
data_sources    →  what is currently attached
The same five tools ship on two hosts from one engine:
| Host | Package | Chart delivery |
|---|---|---|
| DeepSeek Harness plugin | tukey |
live conversation node (Vega canvas) |
| MCP server (Claude Code / Codex / Cursor / any MCP client) | tukey-mcp-server |
SVG file + full Vega-Lite spec in structuredContent |
Every tool is also reachable from Code Mode as await tools.data_*(args), so
the agent can chain the whole analysis inside one program instead of spending a
round trip per step.
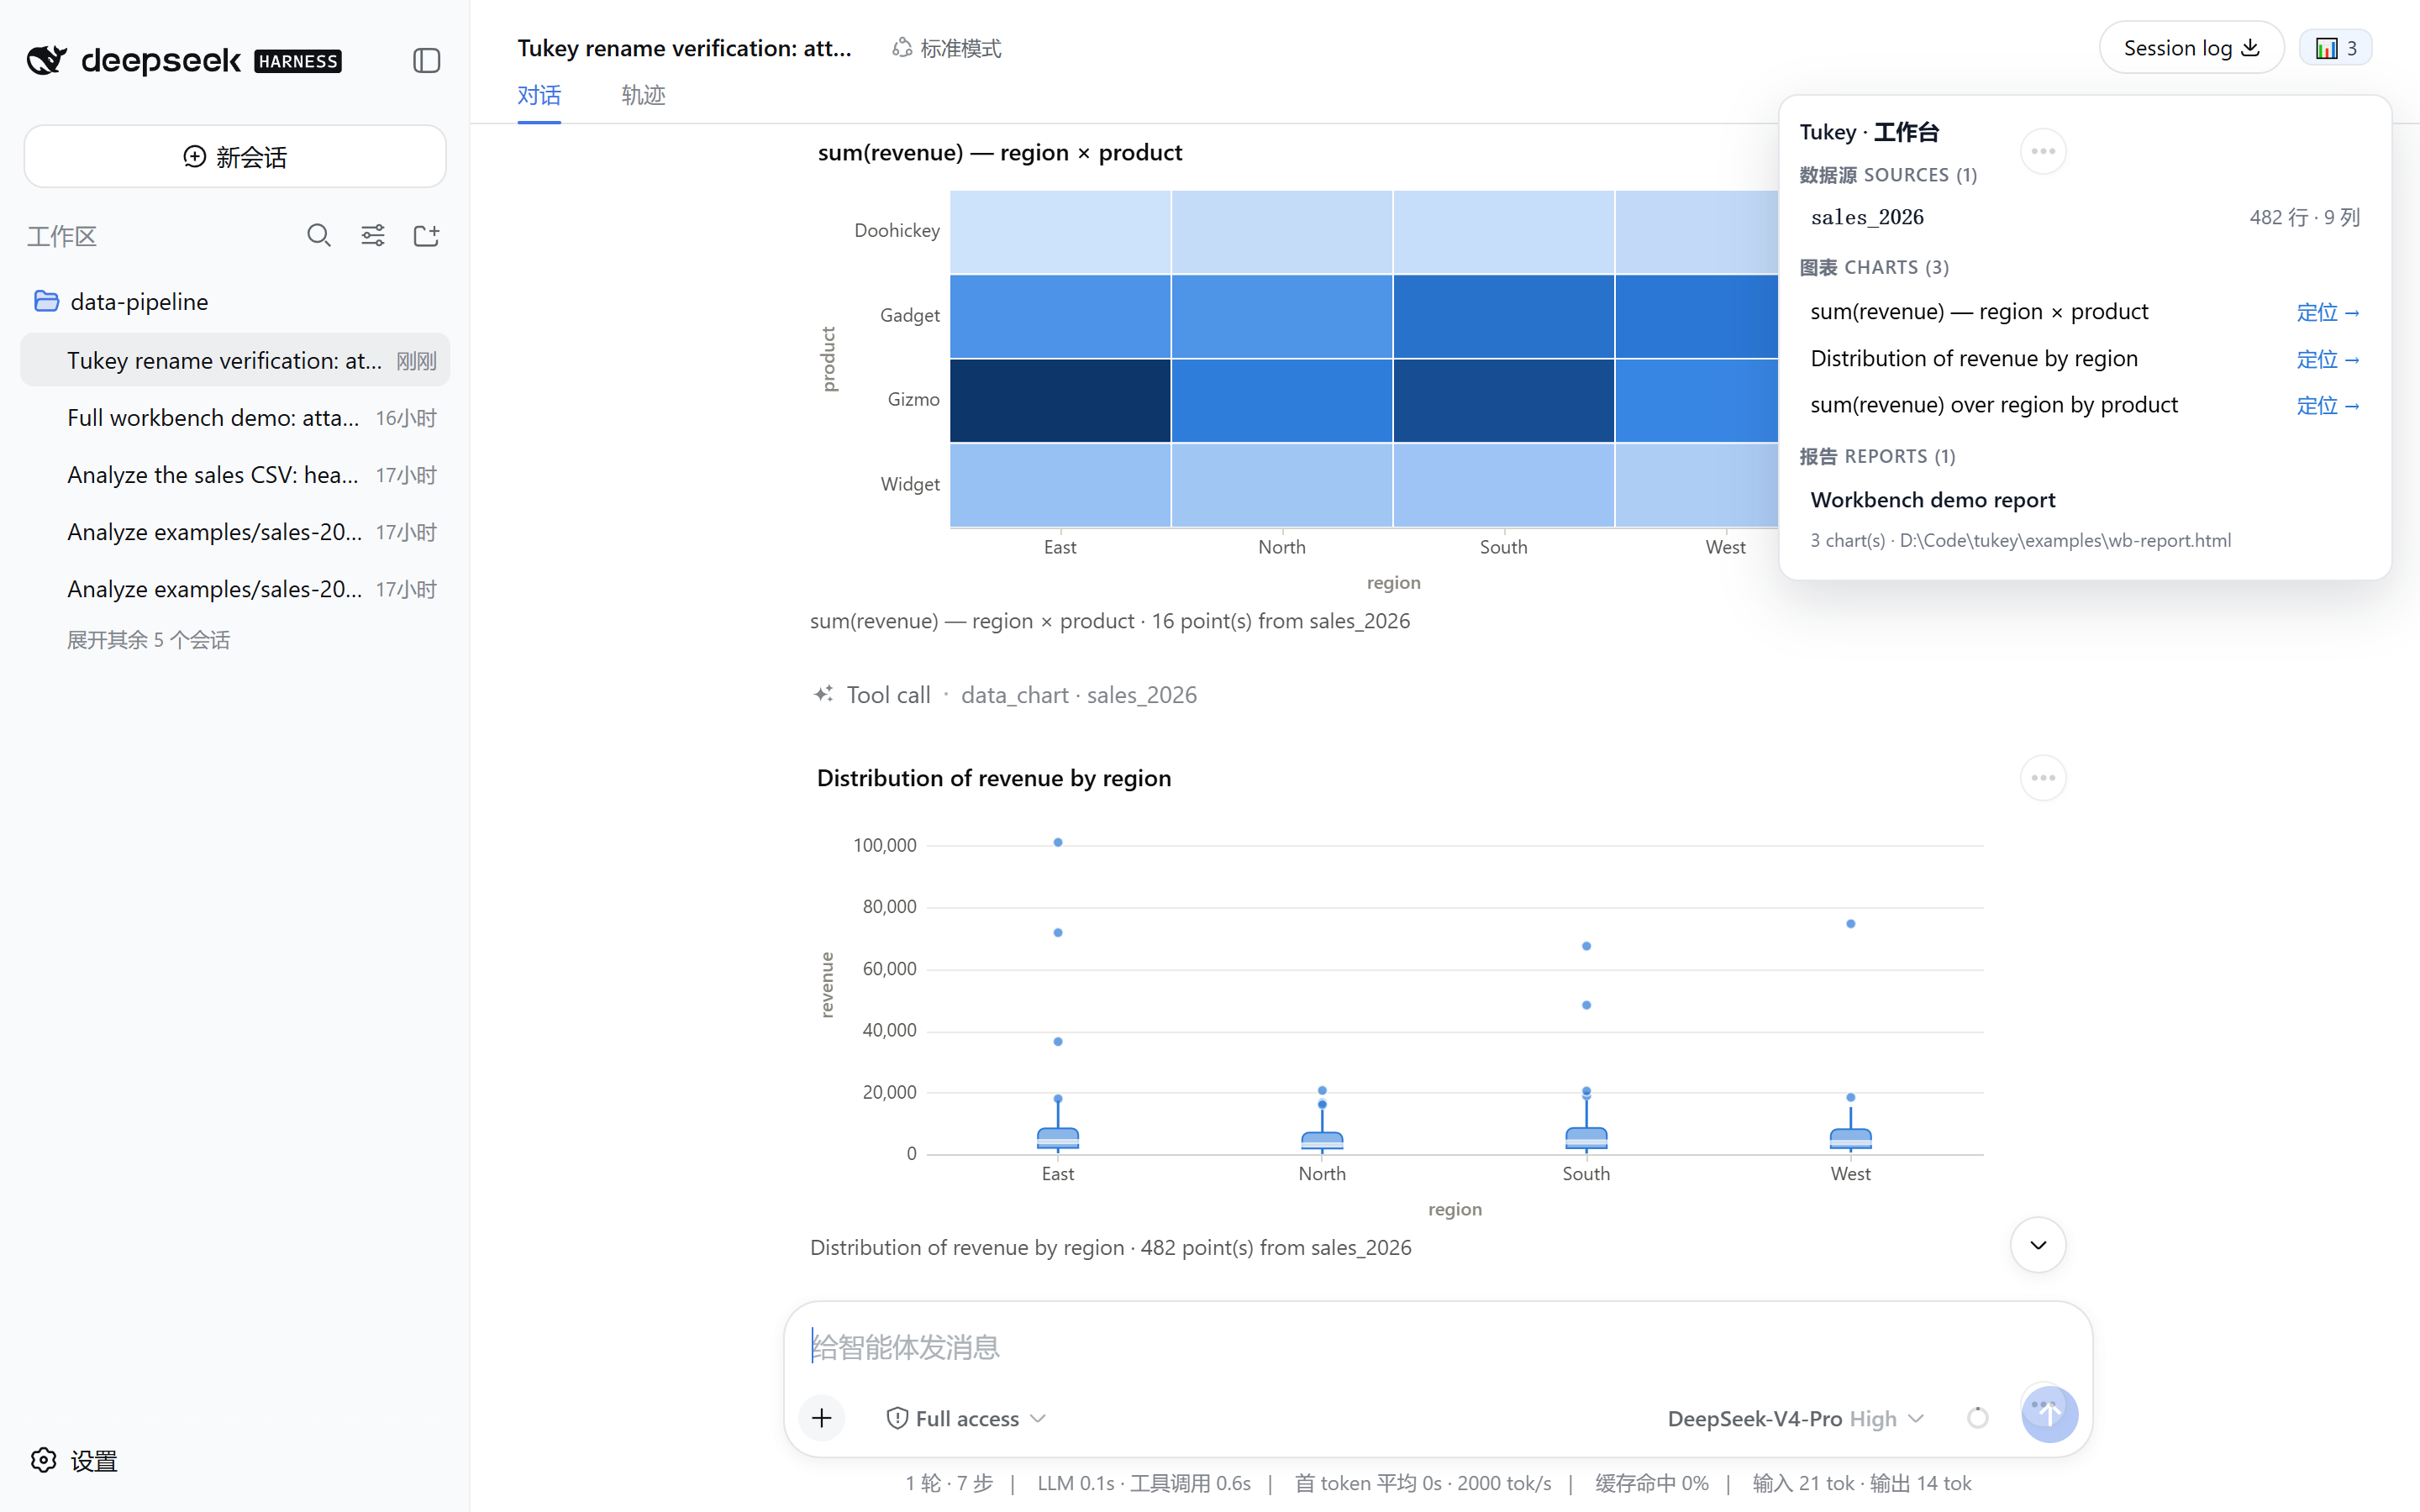
The workbench — a session-header panel listing this session's data sources, a chart gallery with click-to-scroll, and generated reports:
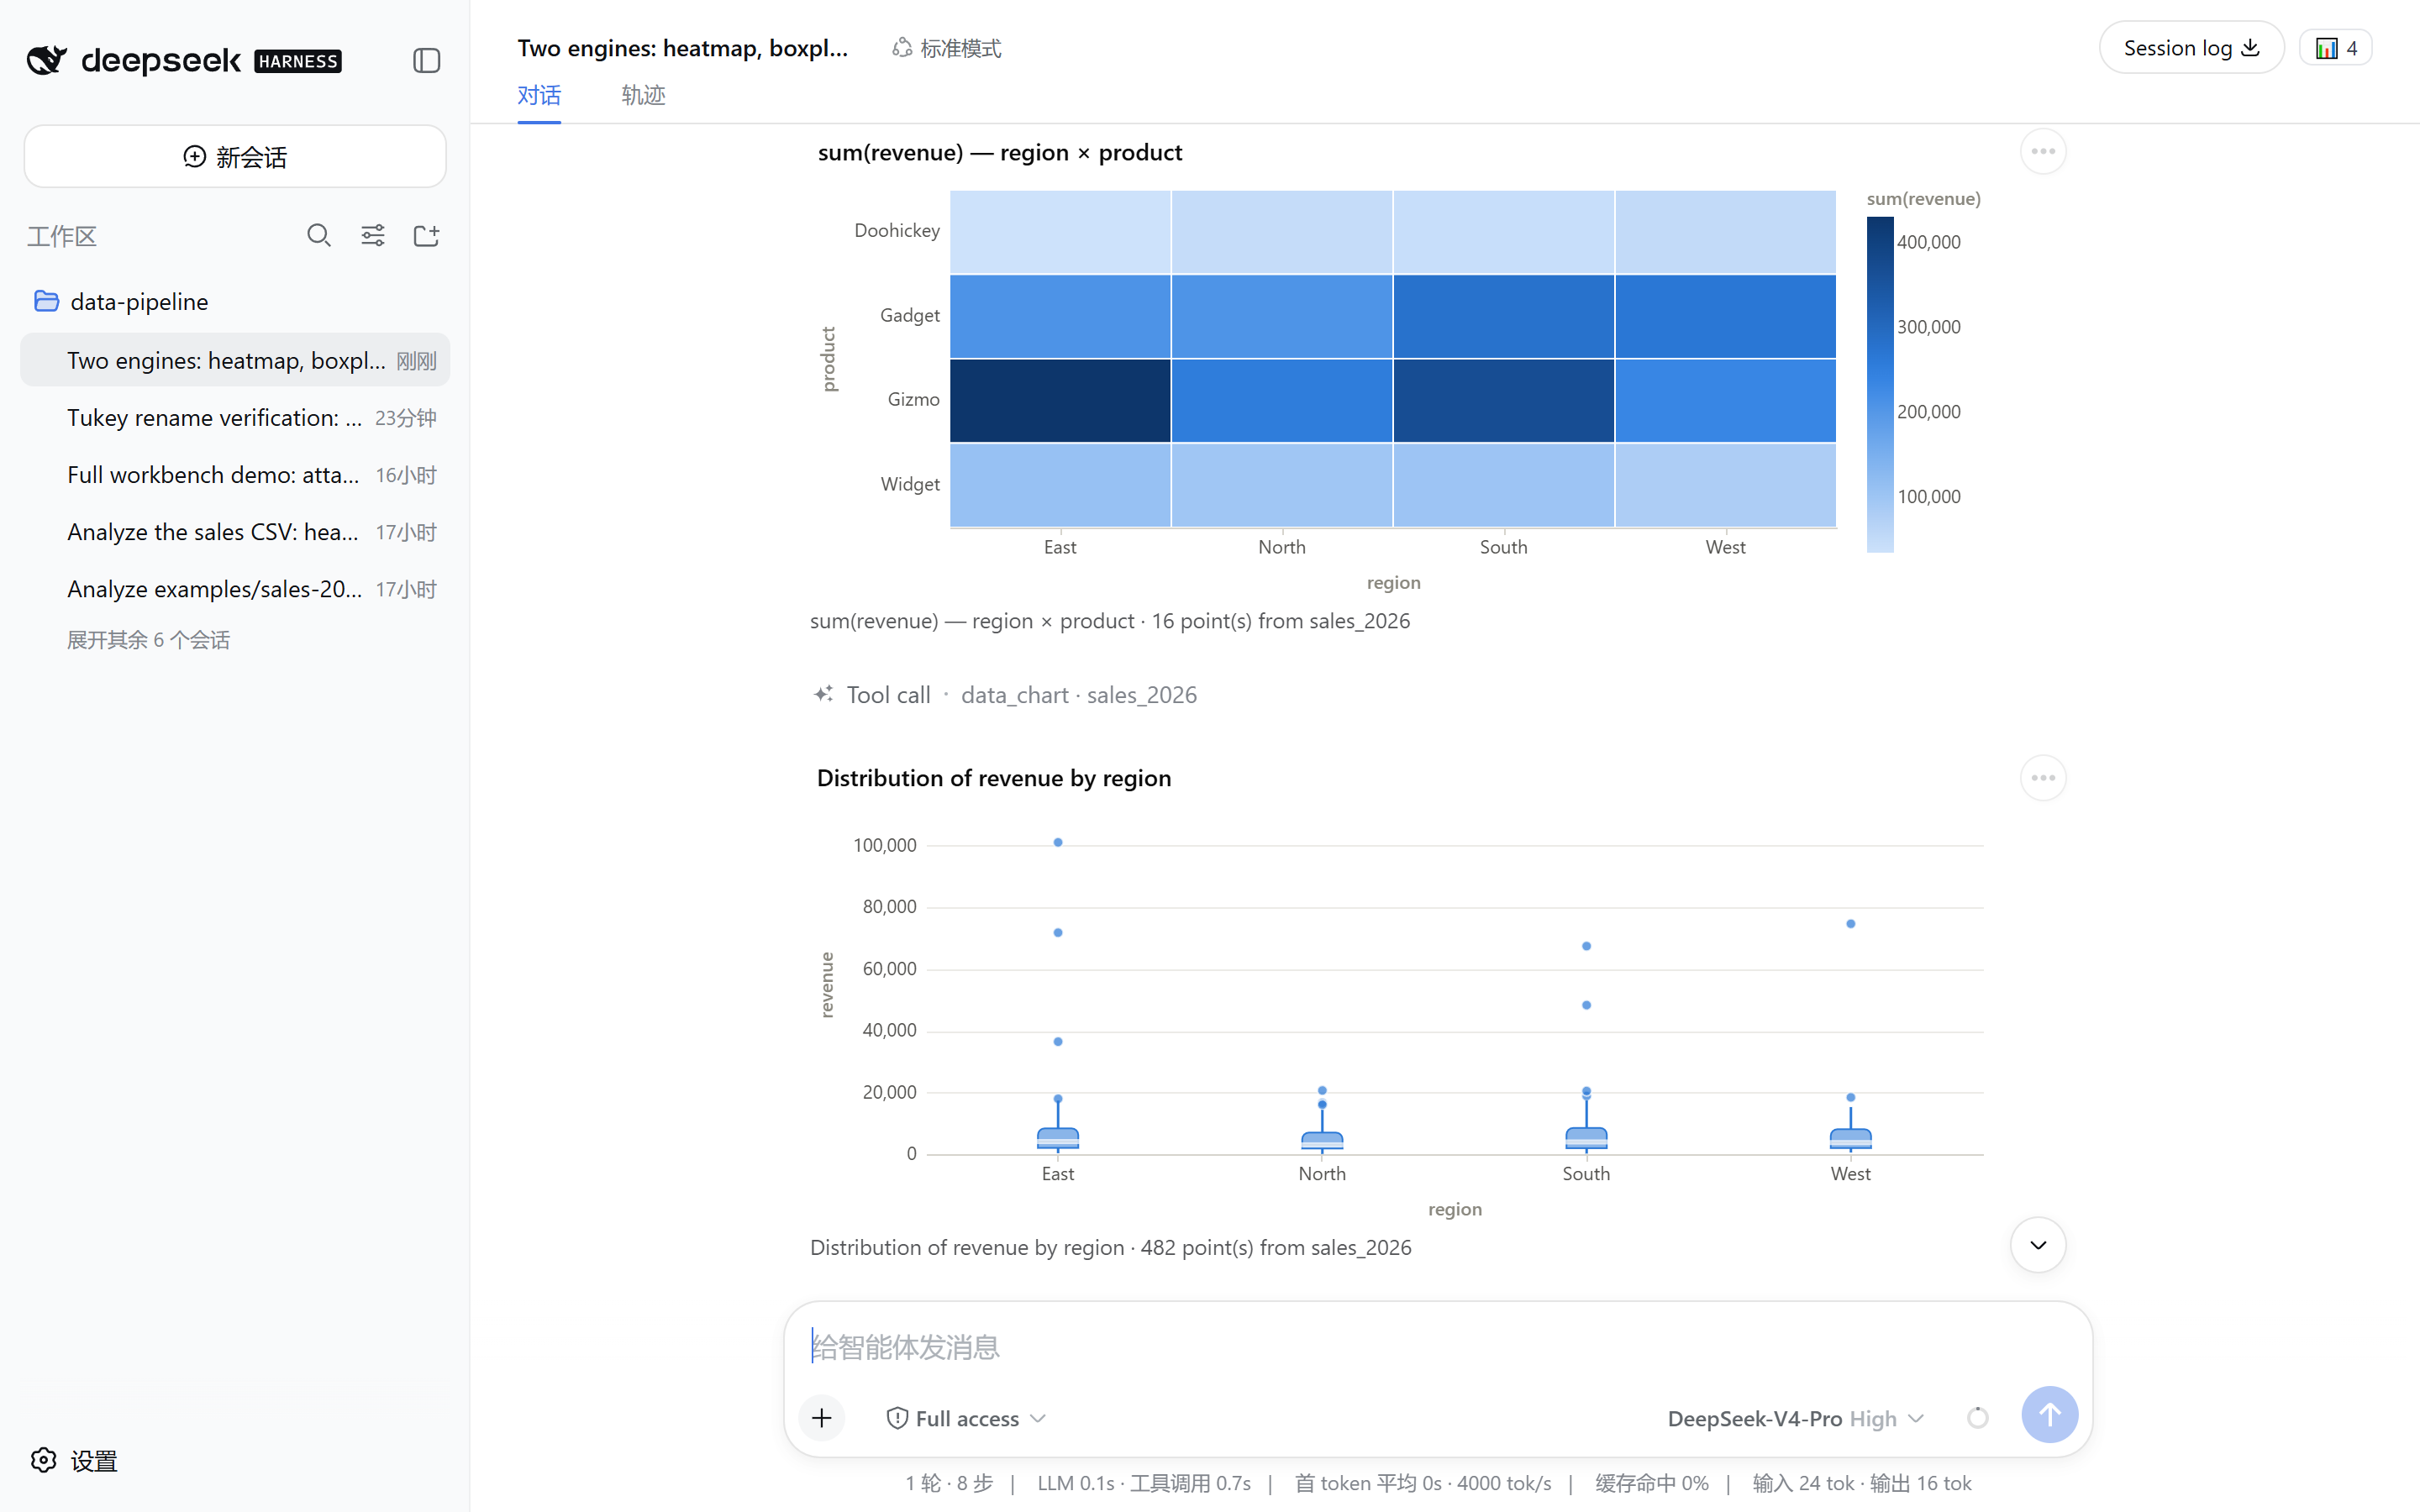
Both engines in one conversation — heatmap and boxplot drawn live by Vega-Lite, sankey and treemap rendered on the host by ECharts:
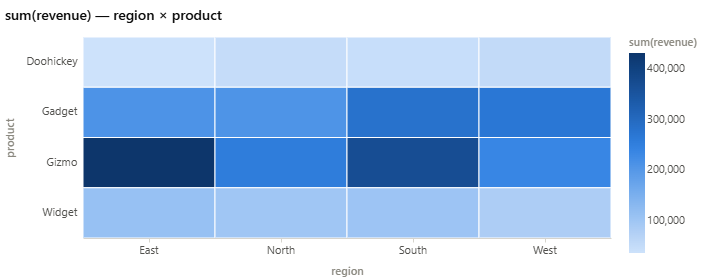
More in-conversation chart kinds (same theme, exported from a live session):
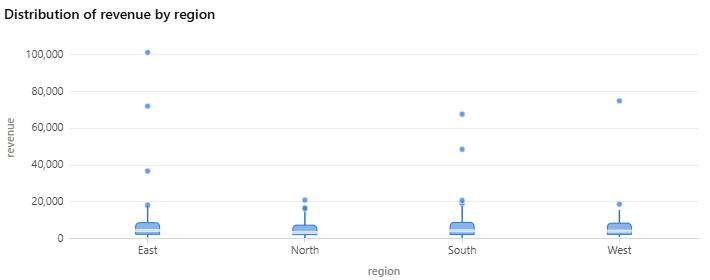
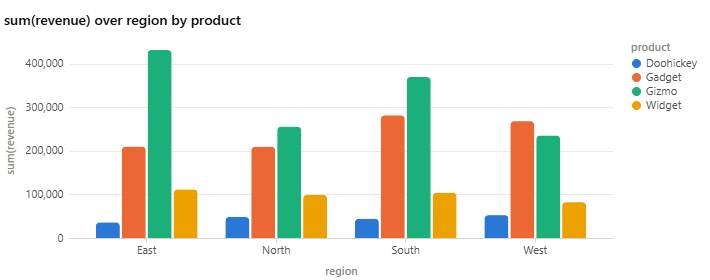
Install
DeepSeek Harness:
dsh plugin --profile web add tukey
Claude Code (or any MCP client, via stdio):
claude mcp add tukey -- npx -y tukey-mcp-server
Architecture
Three decisions shape the codebase.
The engine knows nothing about the harness. @tukey/core takes paths
and SQL and returns lossless JSON. It imports no dsh, MCP, or CLI type. That is
what lets the same analysis ship to Claude Code, Codex, and Cursor through an
MCP adapter later without a second implementation — the single largest factor
in whether a plugin reaches an audience beyond one host.
DuckDB does the statistics. SUMMARIZE returns min/max/avg/std/quartiles/
approx_unique/null_percentage for every column in one pass, and reads CSV,
Parquet and JSON directly with full-file type inference. Only IQR outliers,
duplicate-row detection, and the judgement about what is worth flagging are
written by hand.
Two chart engines, chosen per kind — and the client bundles one. Vega-Lite owns the exploratory kinds: its grammar keeps the spec short and the browser half renders it live and interactive. ECharts covers the shapes Vega-Lite has no grammar for at all — flow (sankey), hierarchy (sunburst, treemap), and a single-value KPI (gauge). Bundling ECharts in the browser too would add ~600 kB to a single-file plugin bundle every session downloads, chart or not, so those kinds are rendered to SVG on the host and travel as markup inside the event; the spec rides along, so a client that does speak ECharts can render it live. Measured cost to the browser bundle: 0 kB.
Charts are specs carried on session events. The harness tool-card
kinds are a closed set — generic, terminal, diff, search, web — with
no chart member, so a tool result can only ever degrade a chart to text. A real
chart has to come from a conversation node, which the client half registers.
That constraint turned out to pick the chart format too. A conversation node must rebuild its view as a pure function of durable events — no clock, no random, no live state — and the engine prefers whole-value checkpoints over deltas. A Vega-Lite spec with its data inlined is exactly that: one plain JSON value that replays byte-for-byte. Vega-Lite was chosen because it satisfies the replay rule, not because it is a popular chart library.
@tukey/core            engine, profiling, DB connectors, chart specs  (host-agnostic)
  ├── @tukey/report    Vega-Lite -> SVG (pure JS) + self-contained HTML reports
  ├── tukey            dsh host half: 7 tools + chart event
  │     └── ./client         dsh browser half: conversation node + Vega canvas
  └── tukey-mcp-server stdio MCP server: same 7 tools, charts as SVG files
Development
pnpm install
pnpm -r run build
pnpm -r run test
89 tests: 58 over the core (SQL policy, JSON conversion, profiling with exact
distinct counts, charts, and live PostgreSQL/MySQL connector tests that
auto-skip without the Docker fixtures), 5 over the report builder, 14 driving
the real dsh plugin tools end to end against DuckDB (including per-agent
isolation), and 9 protocol-level MCP tests over the SDK's in-memory transport
(plus a scripted stdio smoke). Live verification against a running dsh web is scripted in
scripts/mock-llm-scripted.mjs + scripts/verify-live.patch.yml — see
docs/VERIFICATION.md.
Known limitations
These are real and worth reading before building on this.
- PTC 模式 (Code Mode) presets reject direct tool calls — the model must
wrap them in a
run_codeprogram there. Under the Standard preset the tools are called directly. Verified behavior, documented in docs/VERIFICATION.md. - dsh per-agent engines are bounded, not lifecycle-tracked. Each dsh agent session gets its own engine (no alias collisions), but the harness does not notify plugins on agent disposal, so the plugin holds at most 32 engines and evicts the least-recently used — that session transparently re-attaches on its next call.
- The client bundle is ~860 kB. Vega is inlined because the harness serves exactly one file per plugin and has no route for sibling chunks, so a chart-free session still pays for it.
data_attachtakes any path the host process can read. There is no workspace fencing yet; it inherits whatever the harness sandbox allows.- XLSX depends on DuckDB's
read_xlsx, which may need an extension download on first use. CSV, Parquet and JSON are covered by tests; XLSX is not.
Notes on the dsh npm packages
Two things cost time here and are worth recording for anyone else building a harness plugin:
latestpoints at a broken line.npm view @deepseek-ai/dsh-tools versionreports0.0.1-rc.1, but the current line is0.1.0-rc.8. Several0.0.1-rc.1packages cannot be installed at all —@deepseek-ai/dsh-client-runtime@0.0.1-rc.1depends on@deepseek-ai/dsh-compactand@deepseek-ai/dsh-session@0.0.1-rc.1depends on@deepseek-ai/dsh-type-meta; neither is published. Pin0.1.0-rc.8.- pnpm's
minimumReleaseAgepolicy blocks the rc line while it is fresh. This repo lifts it inpnpm-workspace.yaml, with a note to restore it once dsh has a stable release.
Roadmap
| M1 | Core + dsh plugin, charts in the conversation — done, live-verified |
| M2 | MCP server: same capability in Claude Code / Codex / Cursor — done ← you are here |
| M3 | HTML report export (prints to PDF), PostgreSQL / MySQL / SQLite, per-agent isolation — done |
| M4 | Workbench panel: data sources, chart gallery with click-to-scroll, report archive — done, live-verified |
License
MIT
相关推荐Related
-
 nexu-io/open-design
🎨 Best DeepSeek Harness Design Plugin. The open-source Claude Design alternative. 🖥️ Local-first desktop app. 🖼️ Your…
nexu-io/open-design
🎨 Best DeepSeek Harness Design Plugin. The open-source Claude Design alternative. 🖥️ Local-first desktop app. 🖼️ Your…
-
 freestylefly/awesome-gpt-image-2
Prompt as Code | GPT-Image2 工业级提示词引擎与模板库,530+ 个案例逆向工程,20+ 套工业级模板,并提炼出Skills,持续更新中
freestylefly/awesome-gpt-image-2
Prompt as Code | GPT-Image2 工业级提示词引擎与模板库,530+ 个案例逆向工程,20+ 套工业级模板,并提炼出Skills,持续更新中
-
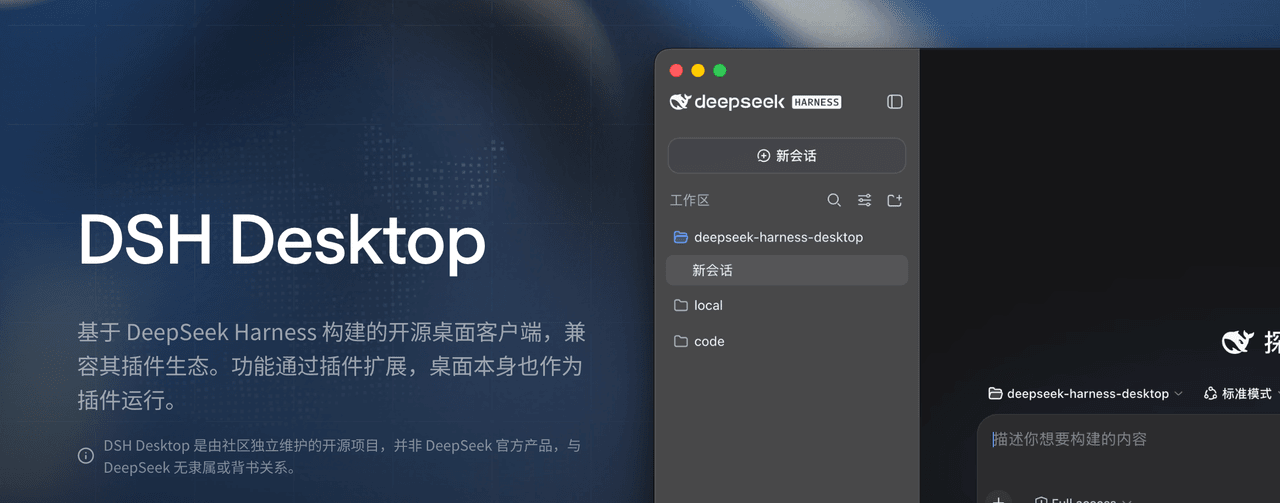 anywhere-labs/dsh-desktop
为 DeepSeek Harness (DSH) 插件生态打造的现代化桌面端解决方案。万物皆「插件」,桌面本身也是「插件」。
anywhere-labs/dsh-desktop
为 DeepSeek Harness (DSH) 插件生态打造的现代化桌面端解决方案。万物皆「插件」,桌面本身也是「插件」。
- Nagi-ovo/voyager Enhancement suite for Gemini, AI Studio, Claude & ChatGPT — plus a prompt manager for any web UI, DeepSeek Harness inclu…
-
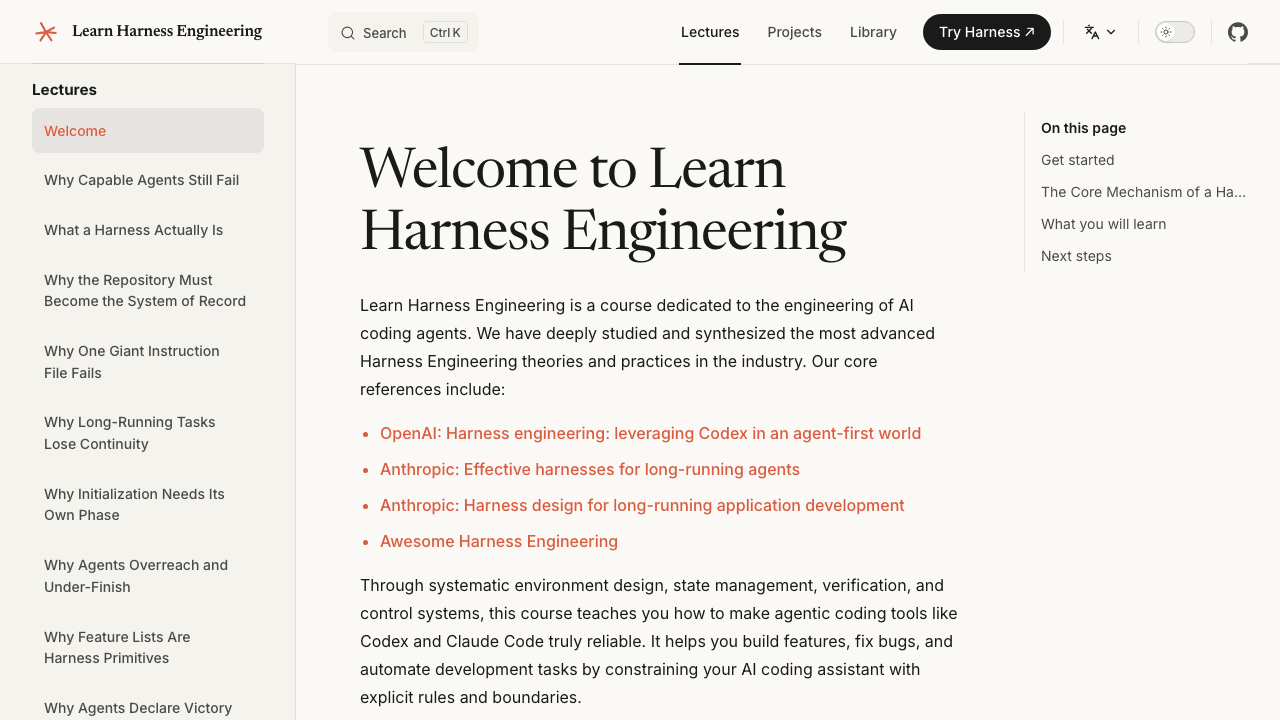 walkinglabs/learn-harness-engineering
Harness engineering beginner tutorial, from 0 to 1
walkinglabs/learn-harness-engineering
Harness engineering beginner tutorial, from 0 to 1
-
 awesome-dsh-plugin/awesome-dsh-plugin
A curated list of plugins for DeepSeek Harness (dsh) · DeepSeek Harness 插件精选列表
awesome-dsh-plugin/awesome-dsh-plugin
A curated list of plugins for DeepSeek Harness (dsh) · DeepSeek Harness 插件精选列表
-
 MemTensor/MemOS
Self-evolving memory OS for LLM & AI Agents: ultra-persistent memory, hybrid-retrieval, and cross-task skill reuse, with…
MemTensor/MemOS
Self-evolving memory OS for LLM & AI Agents: ultra-persistent memory, hybrid-retrieval, and cross-task skill reuse, with…
- yjh051108/dsh-routing-suite dsh-routing-suite — injector + router-standard kit: install the runtime injector first, then the task-aware reasoning-mo…