guhanfei-ai/dsh-grafana
粘贴一个 Grafana 仪表盘 URL,并通过与 DeepSeek Harness 的对话进行微调——粘贴大盘 URL,对话微调,写回 Grafana 调试可视化
Project Overview项目介绍
This is a native DeepSeek Harness plugin that adds agent-native Grafana observability capabilities to DSH. It lets DSH agents interact directly with Grafana dashboards, live metrics, trends, and alerts via the Grafana API, without requiring screenshots of dashboards to work. All changes to dashboards are safe and reviewable, with every write operation requiring explicit user approval through DSH’s native approval flow. It stores Grafana service account credentials in DSH’s local encrypted credential store, so credentials never get exposed accidentally. The project is currently pre-1.0, with core update paths covered by safety controls and automated tests, but Grafana 12+ compatibility is not yet certified.
Typical workflow starts with installing the plugin via the DSH CLI command, which is dsh plugin --profile <profile> add github:guhanfei-ai/dsh-grafana#v<version> for a tagged immutable release. After installation, you restart your selected DSH profile, then configure your Grafana URL and service account token in DSH Web’s Settings > Plugins > Grafana assistant. You can then ask your DSH agent to fetch a dashboard by URL or UID, search dashboards by title or tag, query live panel data, or edit dashboard elements like queries, thresholds, and layout. The agent automatically preserves folder structure and checks for concurrent edits before applying any changes.
The plugin requires Node.js 20.11 or newer, and has been verified to work with DSH versions from 0.1.0-rc.6 up to 0.1.3-alpha.2. It supports Grafana 10 and 11, which use the legacy dashboard HTTP API that the plugin relies on. While the legacy endpoints may still work on Grafana 12+, compatibility is not yet certified, so use Grafana 12+ at your own risk. There is no build step required, as the plugin is written in plain ESM JavaScript, so you just install it and restart DSH to activate it. It is released under the permissive MIT open source license.
这是一个专为DeepSeek Harness开发的原生插件,用于实现AI代理原生的Grafana可观测性集成,支持仪表盘获取、实时指标查询、仪表盘搜索、编辑面板配置等功能。它直接调用Grafana API操作仪表盘JSON,无需截图,所有写入操作都需要DSH用户手动批准,保障操作安全。项目当前处于pre-1.0版本,核心更新路径已通过安全控制和自动化测试,但尚未认证Grafana 12及以上版本的兼容性。
插件支持按URL或UID获取仪表盘,也能对大型仪表盘生成结构化摘要,可按标题和标签搜索仪表盘,还能复制生成新仪表盘并返回新地址,自动保存仪表盘到指定文件夹。它会在写入前检测并发编辑冲突,将Grafana服务账号凭证保存在本地DSH凭证存储中,支持配置多个命名Grafana数据源,每次工具调用可指定目标数据源。
插件要求Node.js 20.11或更高版本,支持DSH 0.1.0-rc.6到0.1.3的预发布版本,兼容Grafana 10/11的旧版仪表盘API。安装无需构建步骤,直接通过dsh plugin命令添加对应GitHub仓库地址即可,安装后重启DSH配置即可使用。插件采用MIT开源许可,敏感仪表盘数据会发送给模型提供商,用户需注意数据安全合规。
请帮我安装这个 DSH 插件。安装前先完成【兼容性检查 + 安全性检查】,检查通过再动手。

插件:dsh-grafana(guhanfei-ai/dsh-grafana)
仓库:https://github.com/guhanfei-ai/dsh-grafana
本站详情页:https://www.yhbd.top/plugins/guhanfei-ai-dsh-grafana/
本站登记:类型 plugin · 归类 原生 DSH 插件 · 许可证 MIT · ⭐ 7 · 最近提交 2026-09-30 · 主语言 JavaScript

按下面顺序执行,每步先把结论告诉我,再进入下一步:

【1 兼容性检查】
① 我这边:DSH 版本、Node 版本、操作系统、当前 profile(web / desktop)。
② 读它的 README、package.json、插件 manifest,列出它要求的 DSH 版本 / Node 版本 / 操作系统 / 外部依赖 / 需要另外先装的运行时。
③ 逐条比对,结论只写「满足 / 不满足 / 未知」三种;不满足的给出可行替代方案。
④ 检查是否和我已装的插件冲突:命令名重复、skill / tool 重名、端口占用、重复注册的 MCP server。

【2 安全性检查】
① 仓库可信度:和上面「本站登记」是否一致;star / fork 数、创建时间、最近提交,是否归档或长期停更。
② 安装脚本:逐行看 package.json 的 preinstall / install / postinstall,以及 install.sh、setup.ps1 之类脚本。出现 curl|bash、下载后直接执行、混淆代码、访问与插件功能无关的域名,立刻停下来告诉我,不要继续装。
③ 依赖:列出新增依赖,标出无人维护、或与知名包拼写近似的可疑包(typosquatting)。
④ 权限与副作用:它会读写哪些目录、访问哪些域名、需要哪些 DSH 权限(filesystem / network / shell / clipboard 等),以及怎么卸载和回滚。
⑤ 如果它要求 sudo / 管理员权限,或权限明显超出功能所需,先停下来问我。

【3 安装】
上面两步没有「不满足」和「高危项」时才执行;用官方推荐方式安装,不要自行提权。

【4 汇报】
用表格输出:检查项 / 结论 / 依据 / 是否需要我决策。拿不准的一律写「未知」并说明要我怎么确认——不要猜,也不要替我决定。
Send this message to DSH in your current session: it verifies compatibility and security first (answering met / not met / unknown item by item) and only installs once everything checks out — it will stop and ask you if it finds a high-risk item. The box scrolls; the copy is the full prompt. CLI install commands may not be accurate across systems, so DSH is the safer route.把上面这条消息直接发给当前会话里的 DSH:它会先核对兼容性与安全性(逐条给「满足 / 不满足 / 未知」),确认没问题再安装,有高危项会停下来问你。框内可滚动,复制到的是完整提示词;安装命令不一定准确,发给 DSH 更稳。
- Only 7 stars - very few users, little community feedback星标只有 7,几乎没人在用,遇到问题缺少社区反馈
DSH walks through these 9 checksDSH 会逐条核对这 9 项
Compatibility兼容性
- DSH, Node, OS and profile requirementsDSH 版本 / Node 版本 / 操作系统 / profile 是否满足要求
- External dependencies and runtimes (Electron / Python / Docker, ...)外部依赖与运行时(Electron / Python / Docker 等)是否齐备
- Conflicts with installed plugins: command names, skill / tool names, ports, duplicate MCP registration与已装插件是否冲突:命令名、skill / tool 重名、端口占用、重复 MCP 注册
Security安全性
- Repo matches the facts registered here; archived or abandoned?仓库是否与页面登记一致,是否归档或长期停更
- Safety of preinstall / install / postinstall and install.sh / setup.ps1preinstall / install / postinstall 与 install.sh、setup.ps1 是否安全
- curl|bash, download-then-execute, obfuscation, unrelated domains → stop immediatelycurl|bash、下载即执行、混淆代码、无关域名 → 立刻停止
- Typosquatting or unmaintained packages among the new dependencies新增依赖里有没有 typosquatting 或无人维护的包
- Requested permissions vs. what the feature actually needs申请了哪些权限、是否超出功能所需(filesystem / network / shell / clipboard)
- Any sudo / admin requirement, plus uninstall and rollback是否要求 sudo / 管理员权限,以及卸载与回滚方式
Anything uncertain must be marked unknown with a note on how to confirm it. This site's signal screen is a static snapshot, not a security audit.拿不准的必须标「未知」并说明要我怎么确认。本站的信号筛查是静态快照,不能替代安全审计。
Or use CLI install (for developers)或使用命令行安装(适合开发者)
CLI Install命令行安装
dsh plugin --profile web add github:guhanfei-ai/dsh-grafana把 guhanfei-ai/dsh-grafana 加入你的 DSH 配置(web profile)即可启用。
READMEREADME
dsh-grafana
A DeepSeek Harness plugin for agent-native Grafana observability — dashboards, live metrics, trends, alerts and cross-source investigation, with safe, reviewable dashboard updates. It operates on Grafana APIs and dashboard JSON directly; no screenshots required.
Project status: pre-1.0. The safety controls and automated tests cover the core update path, but Grafana 12+ compatibility is not yet certified.
Why dsh-grafana
- Fetch a dashboard by browser URL or UID, or request a compact structural summary for large dashboards.
- Search dashboards by title and tag.
- Query the live data behind panels by pasting the dashboard or panel-view URL.
- Duplicate a dashboard into a brand-new copy and get its URL back.
- Edit panels, queries, thresholds, variables, and layout through conversation.
- Preserve the dashboard folder automatically.
- Detect concurrent edits before writing.
- Require native DSH user approval for every write.
- Keep service-account credentials in the local DSH credential store.
- Configure several named Grafana sources and target one per tool call.
Requirements
| Component | Supported baseline |
|---|---|
| Node.js | 20.11 or newer |
| DeepSeek Harness | Prerelease peers from 0.1.0-rc.6 through 0.2.0-rc.2 (verified baselines: 0.1.0-rc.6, 0.1.1-rc.2, 0.1.2-rc.1, 0.1.3-alpha.2, 0.1.5-rc.1, 0.1.7-rc.2, 0.2.0-rc.2; prerelease matching depends on the supported version tuple) |
| Grafana | Legacy Dashboard HTTP API as documented for Grafana 10/11 |
Grafana 12 introduced a new dashboard API. The legacy endpoints used by this plugin may remain available, but Grafana 12+ is not part of the certified matrix yet.
There is no build step: the plugin is plain ESM JavaScript, so installing it is enough — nothing to compile or bundle before it loads.
Installation
Install a released, immutable tag whenever possible:
dsh plugin --profile <profile> add github:guhanfei-ai/dsh-grafana#v<version>
Install the mutable development branch only for testing:
dsh plugin --profile <profile> add github:guhanfei-ai/dsh-grafana
For local development:
npm ci
dsh plugin --profile <profile> add link:/absolute/path/to/dsh-grafana
Showing the opening section of the README — the full document lives in the repository以上为 README 开头摘要,完整文档在仓库内 · View the full README on GitHub →在 GitHub 查看完整 README →
Related相关推荐
- x2802490130-prog/dsh-writing-remote Typert remote for dsh-tool-writing: exposes project, library and search data to the client writing panel.
- Fisfzy/dsh-cae-agent 让 DeepSeek Harness (DSH) 通过原生工具直接操控本机 Abaqus/CAE 的 Cordis 插件。21 个 DSH 原生工具覆盖完整建模链(几何/材料/网格/接触/分析步/载荷/边界/作业/ODB),TypeScri…
-
 scriptsnet/dsh-fleet
⚡ DSH 多机算力组网:把朋友间/局域网/云上 ECS 的闲置算力汇聚成分布式 AI 算力池,一台机调用整个团队的算力。一个人掌控多台 Harness 并行开发研究。
scriptsnet/dsh-fleet
⚡ DSH 多机算力组网:把朋友间/局域网/云上 ECS 的闲置算力汇聚成分布式 AI 算力池,一台机调用整个团队的算力。一个人掌控多台 Harness 并行开发研究。
- weisofns/dsh-print3d 3D printing & additive manufacturing plugin for DeepSeek Harness — parametric STL, calibration G-code, STL/G-code analys…
-
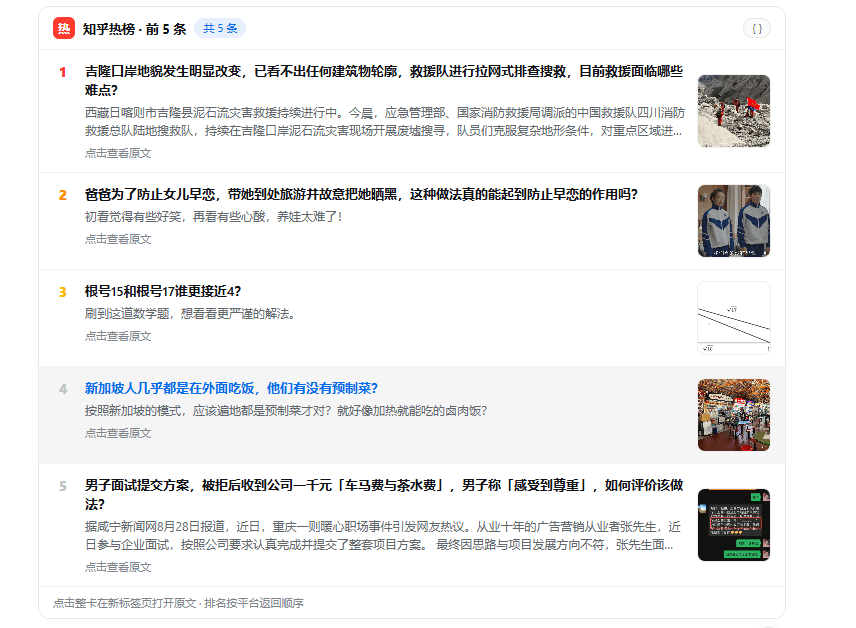 leolee9086/dsh-zhihu-tools
知乎数据开放平台 DSH 静态双面插件:17工具+精美卡片+串行化限流。QQ群1017854502 https://qm.qq.com/q/RAHJuyhQQ
leolee9086/dsh-zhihu-tools
知乎数据开放平台 DSH 静态双面插件:17工具+精美卡片+串行化限流。QQ群1017854502 https://qm.qq.com/q/RAHJuyhQQ
-
 Raiyan007-gb/dsh-remote-tunnel-easy
DSH plugin bundle: scan a QR to open the deepseek-harness web UI on your phone inside the same session - cloudflared qui…
Raiyan007-gb/dsh-remote-tunnel-easy
DSH plugin bundle: scan a QR to open the deepseek-harness web UI on your phone inside the same session - cloudflared qui…
-
 xmanrui/dsh-im
通过扫码或机器人凭据把IM机器人接入DeepSeek Harness(支持飞书、微信、钉钉、企业微信、QQ、Slack、Telegram、Discord和WhatsApp)。 Connect IM bots to DeepSeek Harn…
xmanrui/dsh-im
通过扫码或机器人凭据把IM机器人接入DeepSeek Harness(支持飞书、微信、钉钉、企业微信、QQ、Slack、Telegram、Discord和WhatsApp)。 Connect IM bots to DeepSeek Harn…
-
 tencent-connect/dsh-qqbot
让 QQ Bot 接入 DeepSeek Harness(dsh)的官方插件
tencent-connect/dsh-qqbot
让 QQ Bot 接入 DeepSeek Harness(dsh)的官方插件