
jackma5477001/dsh-system-monitor
DeepSeek 钳制系统监控器
Project Overview项目介绍
This is a native web plugin built exclusively for DeepSeek Harness (DSH), designed for users who run DSH on their own local hardware. It displays real-time hardware usage data of the host machine running the DSH server in the top right navigation bar of DSH's web GUI. The displayed data includes current CPU usage percentage, memory usage percentage, and used versus total memory capacity. The plugin only collects local hardware resource data and does not access any user conversation content, local files, or network data, so it poses no privacy risk to users.
To install the plugin, you first need to navigate to your DSH web profile directory on your local machine, then run pnpm add to add the local plugin directory path to your dependencies. After that, you add a new entry for dsh-system-monitor in the insert list of your cordis.patch.yml configuration file. Finally, you restart the running dsh web service and refresh your browser page for the plugin to take effect. The plugin uses no third-party runtime dependencies, relying only on Node.js's built-in os module to collect hardware data.
The plugin registers a public HTTP GET endpoint /api/dsh-system-monitor/stats that returns structured hardware stats data as JSON, which you can reuse for your own secondary development projects if needed. It also includes two automated test scripts: one that verifies the server's routing, sampling, and cleanup logic, and another that validates the client bundle, layout, polling, and capacity formatting rules. The entire project is released under the open-source MIT license, so you can modify or redistribute it freely per the terms of the license.
dsh-system-monitor 是一款专为 DeepSeek Harness 开发的原生 Web 插件,用于在 DSH 的 Web 界面右上角显示运行 DSH 服务端的主机实时硬件运行数据,包括 CPU 使用率、内存使用率以及已用和总内存容量。监控信息显示在原有界面导航栏下方,右对齐排列,不遮挡原有的会话日志和余额按钮,仅采集本机硬件数据,不读取用户隐私内容。
这个插件的工作流程十分简洁,服务端通过 Node.js 内置的 os 模块每 5 秒采集一次硬件数据,不需要引入任何第三方运行时依赖,浏览器端也每 5 秒请求一次统计接口刷新显示。当服务端或接口暂不可用时,界面会显示占位符 --,恢复可用后自动更新,适合所有使用 DSH Web 版本的用户随时监控主机运行负载。
安装需要进入 DSH Web 配置目录,通过 pnpm 添加插件目录后,在 cordis.patch.yml 的插入列表中添加插件配置,重启 DSH Web 服务并刷新浏览器即可生效。插件提供了可访问的硬件统计 HTTP 接口,支持用户自行二次开发,项目采用 MIT 许可证开源,自带完整的服务端和客户端测试用例。
请帮我安装这个 DSH 插件。安装前先完成【兼容性检查 + 安全性检查】,检查通过再动手。

插件:dsh-system-monitor(jackma5477001/dsh-system-monitor)
仓库:https://github.com/jackma5477001/dsh-system-monitor
本站详情页:https://www.yhbd.top/plugins/jackma5477001-dsh-system-monitor/
本站登记:类型 plugin · 归类 原生 DSH 插件 · 许可证未声明 · ⭐ 2 · 最近提交 2026-09-17 · 主语言 JavaScript

按下面顺序执行,每步先把结论告诉我,再进入下一步:

【1 兼容性检查】
① 我这边:DSH 版本、Node 版本、操作系统、当前 profile(web / desktop)。
② 读它的 README、package.json、插件 manifest,列出它要求的 DSH 版本 / Node 版本 / 操作系统 / 外部依赖 / 需要另外先装的运行时。
③ 逐条比对,结论只写「满足 / 不满足 / 未知」三种;不满足的给出可行替代方案。
④ 检查是否和我已装的插件冲突:命令名重复、skill / tool 重名、端口占用、重复注册的 MCP server。

【2 安全性检查】
① 仓库可信度:和上面「本站登记」是否一致;star / fork 数、创建时间、最近提交,是否归档或长期停更。
② 安装脚本:逐行看 package.json 的 preinstall / install / postinstall,以及 install.sh、setup.ps1 之类脚本。出现 curl|bash、下载后直接执行、混淆代码、访问与插件功能无关的域名,立刻停下来告诉我,不要继续装。
③ 依赖:列出新增依赖,标出无人维护、或与知名包拼写近似的可疑包(typosquatting)。
④ 权限与副作用:它会读写哪些目录、访问哪些域名、需要哪些 DSH 权限(filesystem / network / shell / clipboard 等),以及怎么卸载和回滚。
⑤ 如果它要求 sudo / 管理员权限,或权限明显超出功能所需,先停下来问我。

【3 安装】
上面两步没有「不满足」和「高危项」时才执行;用官方推荐方式安装,不要自行提权。

【4 汇报】
用表格输出:检查项 / 结论 / 依据 / 是否需要我决策。拿不准的一律写「未知」并说明要我怎么确认——不要猜,也不要替我决定。
Send this message to DSH in your current session: it verifies compatibility and security first (answering met / not met / unknown item by item) and only installs once everything checks out — it will stop and ask you if it finds a high-risk item. The box scrolls; the copy is the full prompt. CLI install commands may not be accurate across systems, so DSH is the safer route.把上面这条消息直接发给当前会话里的 DSH:它会先核对兼容性与安全性(逐条给「满足 / 不满足 / 未知」),确认没问题再安装,有高危项会停下来问你。框内可滚动,复制到的是完整提示词;安装命令不一定准确,发给 DSH 更稳。
- No license declared - all rights reserved by default; ask the author before commercial use or redistribution未声明开源许可证 —— 默认「保留所有权利」,商用或再分发前先问作者
- Only 2 stars - very few users, little community feedback星标只有 2,几乎没人在用,遇到问题缺少社区反馈
DSH walks through these 9 checksDSH 会逐条核对这 9 项
Compatibility兼容性
- DSH, Node, OS and profile requirementsDSH 版本 / Node 版本 / 操作系统 / profile 是否满足要求
- External dependencies and runtimes (Electron / Python / Docker, ...)外部依赖与运行时(Electron / Python / Docker 等)是否齐备
- Conflicts with installed plugins: command names, skill / tool names, ports, duplicate MCP registration与已装插件是否冲突:命令名、skill / tool 重名、端口占用、重复 MCP 注册
Security安全性
- Repo matches the facts registered here; archived or abandoned?仓库是否与页面登记一致,是否归档或长期停更
- Safety of preinstall / install / postinstall and install.sh / setup.ps1preinstall / install / postinstall 与 install.sh、setup.ps1 是否安全
- curl|bash, download-then-execute, obfuscation, unrelated domains → stop immediatelycurl|bash、下载即执行、混淆代码、无关域名 → 立刻停止
- Typosquatting or unmaintained packages among the new dependencies新增依赖里有没有 typosquatting 或无人维护的包
- Requested permissions vs. what the feature actually needs申请了哪些权限、是否超出功能所需(filesystem / network / shell / clipboard)
- Any sudo / admin requirement, plus uninstall and rollback是否要求 sudo / 管理员权限,以及卸载与回滚方式
Anything uncertain must be marked unknown with a note on how to confirm it. This site's signal screen is a static snapshot, not a security audit.拿不准的必须标「未知」并说明要我怎么确认。本站的信号筛查是静态快照,不能替代安全审计。
Or use CLI install (for developers)或使用命令行安装(适合开发者)
CLI Install命令行安装
dsh plugin --profile web add github:jackma5477001/dsh-system-monitor把 jackma5477001/dsh-system-monitor 加入你的 DSH 配置(web profile)即可启用。
READMEREADME
dsh-system-monitor
dsh-system-monitor 是一个 DSH Web 插件,用于显示运行 DSH 的电脑的实时硬件运行信息:
- CPU 使用率
- 内存使用率
- 内存已用容量 / 总容量
插件只采集 DSH 服务端所在电脑的本机资源,不读取对话内容、文件内容或网络数据。
页面位置
信息显示在 Web GUI 右上角,并分为上下两行:
┌──────────────────────────────────────────────────────────────┐
│  会话标题 …                                  [Session log] [余额] │
│                                             CPU 23% · MEM 58% · 8.2GB/16.0GB │
└──────────────────────────────────────────────────────────────┘
上行保留 DSH 原有的 Session log 和余额按钮,下行右对齐显示系统监控数据。
实际效果:

工作方式
- 服务端使用 Node.js 内置的
os模块采集 CPU 和内存数据,不引入第三方运行时依赖; - 服务端每 5 秒更新一次采样结果;
- 浏览器端每 5 秒请求一次统计接口并刷新显示;
- 服务端或接口暂不可用时,界面显示
--,恢复后自动更新; - CPU 使用率通过两次 CPU 时间采样的差值计算。
安装
以 Web profile 为例:
cd ~/.dsh/profiles/web
pnpm add /path/to/dsh-system-monitor
也可以直接安装本地目录:
pnpm add D:/App/code/Project/dph/default/dsh-system-monitor
然后在 ~/.dsh/profiles/web/cordis.patch.yml 的 insert 列表中加入:
- id: dsh-system-monitor
  name: dsh-system-monitor
重启 dsh web 服务并刷新浏览器页面即可生效。
HTTP 接口
插件注册以下接口:
GET /api/dsh-system-monitor/stats
成功响应示例:
{
  "ok": true,
  "data": {
    "status": "ok",
    "cpu": 23,
    "memPercent": 58,
    "memUsed": 8800000000,
    "memTotal": 16000000000,
    "sampledAt": 1789000000000
  }
}
字段说明:
| 字段 | 说明 |
|---|---|
status |
ok 或 error;错误时前端显示占位符 |
cpu |
0–100 的整数百分比;首次采样建立基准,可能暂为 null |
memPercent |
内存使用率百分比 |
memUsed |
已使用内存,单位为字节 |
memTotal |
总内存,单位为字节 |
sampledAt |
采样时间戳,单位为毫秒 |
容量显示规则:总容量不小于 1GB 时显示 GB 并保留 1 位小数,否则按 MB 取整。
测试
在插件目录执行:
node test/smoke.mjs
node test/client-sim.mjs
其中:
smoke.mjs验证服务端路由、采样数据和清理逻辑;client-sim.mjs验证前端 bundle、slot 注册、两行右对齐布局、轮询和容量格式化。
目录结构
lib/index.js       # 服务端采样与 HTTP 路由
lib/client.js      # 浏览器端组件与右上角布局
test/smoke.mjs     # 服务端测试
test/client-sim.mjs # 浏览器端模拟测试
docs/需求文档.md   # 原始需求文档
许可证
MIT
Related相关推荐
-
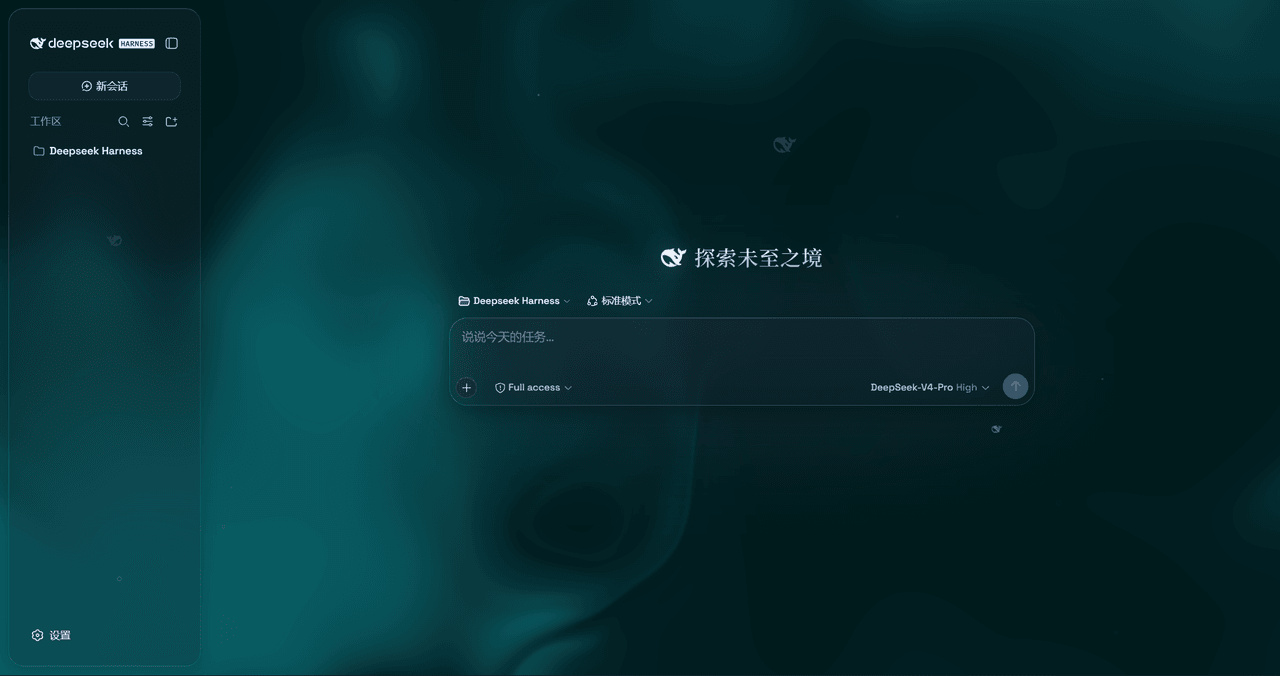 WYH66666666/DSH-Transparent-UI-Plugin
是一层高自由度的玻璃质感主题,套在 DeepSeek Harness 网页端。顶栏、侧边栏、输入框、统计行、轨迹视图都成了磨砂玻璃片。玻璃模糊度、磨砂度、背景(流体或自定义壁纸,壁纸还能单独调模糊和磨砂)全都能在设置卡片里自由调节。关掉开关…
WYH66666666/DSH-Transparent-UI-Plugin
是一层高自由度的玻璃质感主题,套在 DeepSeek Harness 网页端。顶栏、侧边栏、输入框、统计行、轨迹视图都成了磨砂玻璃片。玻璃模糊度、磨砂度、背景(流体或自定义壁纸,壁纸还能单独调模糊和磨砂)全都能在设置卡片里自由调节。关掉开关…
-
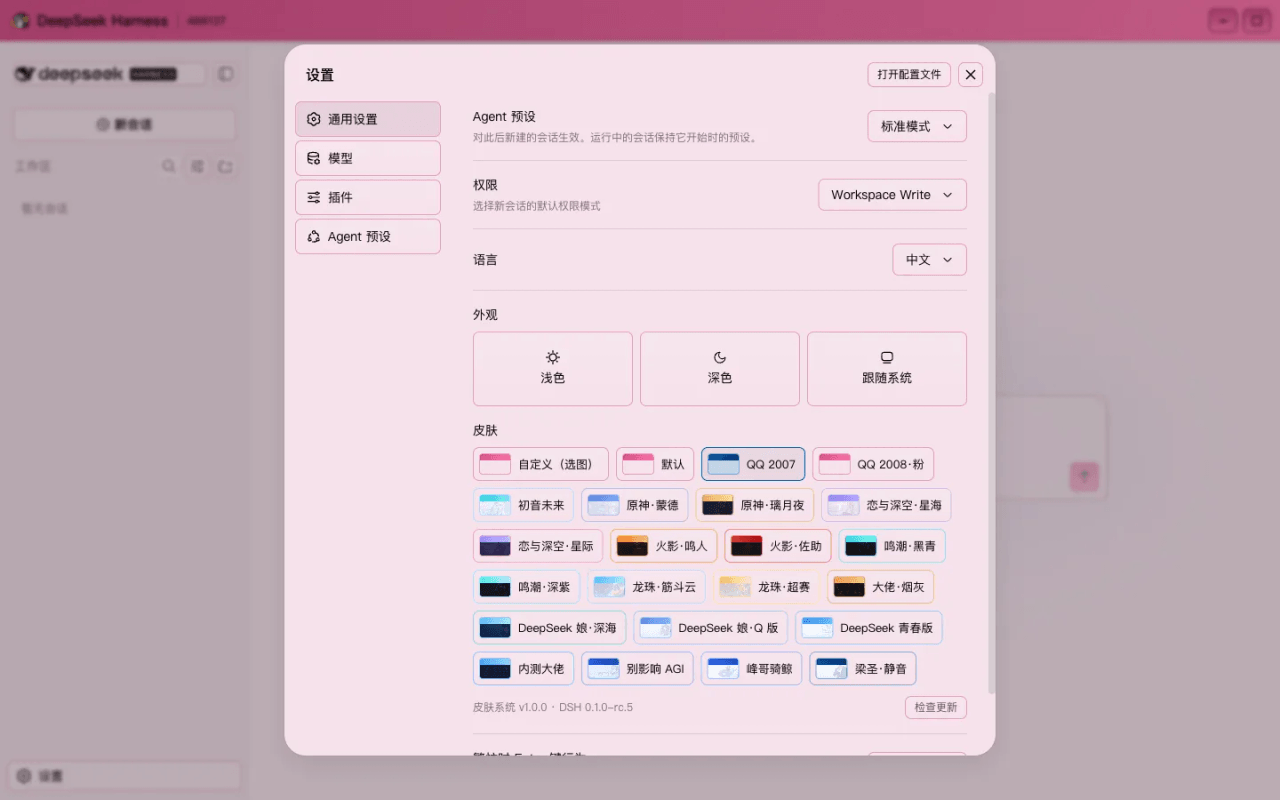 HeiGeAi/deepseek-harness-skin
DeepSeek Harness 换肤系统:21 套内置皮肤 + 一张图生成整套配色的自定义皮肤。数据源驱动,保对比度推导,构建期校验可读性。
HeiGeAi/deepseek-harness-skin
DeepSeek Harness 换肤系统:21 套内置皮肤 + 一张图生成整套配色的自定义皮肤。数据源驱动,保对比度推导,构建期校验可读性。
-
 LaplaceYoung/dsh-qq2006
DSH (DeepSeek Harness) 的 QQ2006 皮肤插件:注册 qq2006 主题、镜像 body[data-ds-skin]、全局皮肤表与完整素材
LaplaceYoung/dsh-qq2006
DSH (DeepSeek Harness) 的 QQ2006 皮肤插件:注册 qq2006 主题、镜像 body[data-ds-skin]、全局皮肤表与完整素材
- Bob-Bo1/dsh-stock-watch DeepSeek Harness (DSH) plugin for local A-share portfolio tracking. Reads a local holdings.json and shows quotes and P&L…
-
 nocobase/nocobase
NocoBase is an open-source AI + no-code platform for building business systems fast. Instead of generating everything fr…
nocobase/nocobase
NocoBase is an open-source AI + no-code platform for building business systems fast. Instead of generating everything fr…
-
 TencentCloudBase/CloudBase-AI-Toolkit
Backend for AI coding agents on CloudBase — database, auth, functions via Plugin, Skills & MCP.
TencentCloudBase/CloudBase-AI-Toolkit
Backend for AI coding agents on CloudBase — database, auth, functions via Plugin, Skills & MCP.
-
 Nagi-ovo/dsh-visualize
在 DSH 对话中生成交互式可视化|Render model-generated interactive cards inside DSH conversations
Nagi-ovo/dsh-visualize
在 DSH 对话中生成交互式可视化|Render model-generated interactive cards inside DSH conversations
-
 SepineTam/mcp-for-stata
Stata-MCP: A MCP server for integrating Stata into your agent loop with a safety-first design.
SepineTam/mcp-for-stata
Stata-MCP: A MCP server for integrating Stata into your agent loop with a safety-first design.