jkrandom-sudo/dsh-ci-doctor
CI 失败 —— 打开日志前即已诊断 —— DSH 插件:监视 GitHub Actions 新失败,将原始日志转化为结构化诊断卡,签名账本识别复发问题
Project Overview项目介绍
dsh-ci-doctor is a CI diagnostics plugin for DeepSeek Harness, exposing two agent tools against GitHub Actions. It parses raw job logs into normalized error signatures, failure categories, suspect files, and trimmed excerpts, and keeps a ledger of signatures so repeat failures are flagged on sight. The watch tool polls for newly failed runs in the background; the diagnose tool returns a markdown diagnosis card for a specific run. All access goes through the already-authenticated gh CLI and is strictly read-only — the plugin never pushes, merges, reruns, or writes to repositories. Requirement: an authenticated GitHub CLI.
dsh-ci-doctor 是 DeepSeek Harness 的 CI 诊断插件,通过两个 agent 工具接入 GitHub Actions。它将原始 job 日志解析为归一化的错误签名、失败分类、可疑文件与裁剪后的日志片段,并维护一张签名账本,重复失败会被即时标记。Watch 工具后台轮询新增失败运行,Diagnose 工具对单次运行输出 Markdown 诊断卡。仅通过已认证的 gh CLI 读取仓库状态,从不写入或触发任何操作。前提:已安装并登录 GitHub CLI。
请帮我安装这个 DSH 插件。安装前先完成【兼容性检查 + 安全性检查】,检查通过再动手。

插件:dsh-ci-doctor(jkrandom-sudo/dsh-ci-doctor)
仓库:https://github.com/jkrandom-sudo/dsh-ci-doctor
本站详情页:https://www.yhbd.top/plugins/jkrandom-sudo-dsh-ci-doctor/
本站登记:类型 plugin · 归类 原生 DSH 插件 · 许可证 MIT · ⭐ 2 · 最近提交 2026-08-14 · 主语言 TypeScript

按下面顺序执行,每步先把结论告诉我,再进入下一步:

【1 兼容性检查】
① 我这边:DSH 版本、Node 版本、操作系统、当前 profile(web / desktop)。
② 读它的 README、package.json、插件 manifest,列出它要求的 DSH 版本 / Node 版本 / 操作系统 / 外部依赖 / 需要另外先装的运行时。
③ 逐条比对,结论只写「满足 / 不满足 / 未知」三种;不满足的给出可行替代方案。
④ 检查是否和我已装的插件冲突:命令名重复、skill / tool 重名、端口占用、重复注册的 MCP server。

【2 安全性检查】
① 仓库可信度:和上面「本站登记」是否一致;star / fork 数、创建时间、最近提交,是否归档或长期停更。
② 安装脚本:逐行看 package.json 的 preinstall / install / postinstall,以及 install.sh、setup.ps1 之类脚本。出现 curl|bash、下载后直接执行、混淆代码、访问与插件功能无关的域名,立刻停下来告诉我,不要继续装。
③ 依赖:列出新增依赖,标出无人维护、或与知名包拼写近似的可疑包(typosquatting)。
④ 权限与副作用:它会读写哪些目录、访问哪些域名、需要哪些 DSH 权限(filesystem / network / shell / clipboard 等),以及怎么卸载和回滚。
⑤ 如果它要求 sudo / 管理员权限,或权限明显超出功能所需,先停下来问我。

【3 安装】
上面两步没有「不满足」和「高危项」时才执行;用官方推荐方式安装,不要自行提权。

【4 汇报】
用表格输出:检查项 / 结论 / 依据 / 是否需要我决策。拿不准的一律写「未知」并说明要我怎么确认——不要猜,也不要替我决定。
Send this message to DSH in your current session: it verifies compatibility and security first (answering met / not met / unknown item by item) and only installs once everything checks out — it will stop and ask you if it finds a high-risk item. The box scrolls; the copy is the full prompt. CLI install commands may not be accurate across systems, so DSH is the safer route.把上面这条消息直接发给当前会话里的 DSH:它会先核对兼容性与安全性(逐条给「满足 / 不满足 / 未知」),确认没问题再安装,有高危项会停下来问你。框内可滚动,复制到的是完整提示词;安装命令不一定准确,发给 DSH 更稳。
- Only 2 stars - very few users, little community feedback星标只有 2,几乎没人在用,遇到问题缺少社区反馈
DSH walks through these 9 checksDSH 会逐条核对这 9 项
Compatibility兼容性
- DSH, Node, OS and profile requirementsDSH 版本 / Node 版本 / 操作系统 / profile 是否满足要求
- External dependencies and runtimes (Electron / Python / Docker, ...)外部依赖与运行时(Electron / Python / Docker 等)是否齐备
- Conflicts with installed plugins: command names, skill / tool names, ports, duplicate MCP registration与已装插件是否冲突:命令名、skill / tool 重名、端口占用、重复 MCP 注册
Security安全性
- Repo matches the facts registered here; archived or abandoned?仓库是否与页面登记一致,是否归档或长期停更
- Safety of preinstall / install / postinstall and install.sh / setup.ps1preinstall / install / postinstall 与 install.sh、setup.ps1 是否安全
- curl|bash, download-then-execute, obfuscation, unrelated domains → stop immediatelycurl|bash、下载即执行、混淆代码、无关域名 → 立刻停止
- Typosquatting or unmaintained packages among the new dependencies新增依赖里有没有 typosquatting 或无人维护的包
- Requested permissions vs. what the feature actually needs申请了哪些权限、是否超出功能所需(filesystem / network / shell / clipboard)
- Any sudo / admin requirement, plus uninstall and rollback是否要求 sudo / 管理员权限,以及卸载与回滚方式
Anything uncertain must be marked unknown with a note on how to confirm it. This site's signal screen is a static snapshot, not a security audit.拿不准的必须标「未知」并说明要我怎么确认。本站的信号筛查是静态快照,不能替代安全审计。
Or use CLI install (for developers)或使用命令行安装(适合开发者)
CLI Install命令行安装
dsh plugin --profile web add dsh-ci-doctor把 jkrandom-sudo/dsh-ci-doctor 加入你的 DSH 配置(web profile)即可启用。
READMEREADME
dsh-ci-doctor
中文 · npm · DeepSeek Harness
CI failure, diagnosed before you even open the logs. dsh-ci-doctor watches GitHub Actions for new failures, turns raw job logs into structured findings — normalized error signatures, failure categories, suspect files, trimmed log excerpts — and remembers every signature it has ever seen, so repeat failures are called out on sight. All through two agent tools and the gh CLI you already have authenticated.
Usage
Just ask your agent in plain language — it picks the right tool:
- "Watch CI on this repo and tell me when something fails" → starts a
ci_watchbackground job. - "Why did the nightly build fail?" → runs
ci_diagnoseon the latest failed run and hands you the diagnosis card. - "Diagnose run 31782742089 on cli/cli" → targeted diagnosis of one specific run.
You get a markdown diagnosis card straight in the chat:
## CI diagnosis: cli/cli run #31782742089

**Conclusion:** failure · [run](https://github.com/cli/cli/actions/runs/31782742089)

### Job: Issue Triage (skills-driven)

**Failed steps:** triage
**Signatures:**

- `81a0edf32878` (timeout, first time seen) — server:http_server Session timeout configured…
  **Suspect files:** `script/triage.ts`

<details><summary>Log excerpt</summary>
…
</details>
What it does
1. Watch — the ci_watch tool. Starts a background job that polls for new failed runs (the first poll sets a baseline, so historical red runs never fire the alarm):
{ "repo": "owner/name", "branch": "main", "intervalSeconds": 30, "timeoutMinutes": 60 }
- Streams status lines you can read any time; cancel any time.
- Backs off exponentially on transient errors, gives up after 5 consecutive failures, fails immediately on auth errors.
- On detection it settles with a ready-made next step:
call ci_diagnose with repo="…" runId=…. - Watch a repo explicitly, or omit
repoto watch the current working directory's repository.
2. Diagnose — the ci_diagnose tool. Point it at a run (or the latest failed run) and it returns the card shown above:
Showing the opening section of the README — the full document lives in the repository以上为 README 开头摘要,完整文档在仓库内 · View the full README on GitHub →在 GitHub 查看完整 README →
Related相关推荐
-
 Devin-AXIS/iPolloWork
Enterprise-grade, local-first Agent Workbench for people and agent teams. A unified multi-engine workspace for Codex Har…
Devin-AXIS/iPolloWork
Enterprise-grade, local-first Agent Workbench for people and agent teams. A unified multi-engine workspace for Codex Har…
-
 ysr666/dsh-vision-router
Eyes for text-only DeepSeek Harness agents: built-in free vision chain (no key) + pixel-level vision tools (Q&A, groundi…
ysr666/dsh-vision-router
Eyes for text-only DeepSeek Harness agents: built-in free vision chain (no key) + pixel-level vision tools (Q&A, groundi…
-
 Anionex/dsh-vision-toolkit
[dsh]为纯文本模型设计更强大的视觉工具箱:一行安装使用、粘贴图片直接识别、多张图片问答、截图到前端UI 还原等|DeepSeek Harness-native integration for agent-vision-toolkit: …
Anionex/dsh-vision-toolkit
[dsh]为纯文本模型设计更强大的视觉工具箱:一行安装使用、粘贴图片直接识别、多张图片问答、截图到前端UI 还原等|DeepSeek Harness-native integration for agent-vision-toolkit: …
-
 sunchaokun/PPT-Design-Skill
Precision PPT design skill for OpenCode/Claude Code/Codex, with 40,000+ styles, pixel-perfect Build Mode control, AI ima…
sunchaokun/PPT-Design-Skill
Precision PPT design skill for OpenCode/Claude Code/Codex, with 40,000+ styles, pixel-perfect Build Mode control, AI ima…
-
 zhaoolee/notes
开源版锤子便签,复刻锤科美学,一键Docker私有化部署,支持skill调用,支持dsh plugin,支持多租户,一键生成公众号格式,支持导出便签为图片
zhaoolee/notes
开源版锤子便签,复刻锤科美学,一键Docker私有化部署,支持skill调用,支持dsh plugin,支持多租户,一键生成公众号格式,支持导出便签为图片
-
 volcengine/ark-cli
The fastest way to put Volcengine Ark in your terminal and your AI agent — go from prompt to generated media, multimod…
volcengine/ark-cli
The fastest way to put Volcengine Ark in your terminal and your AI agent — go from prompt to generated media, multimod…
-
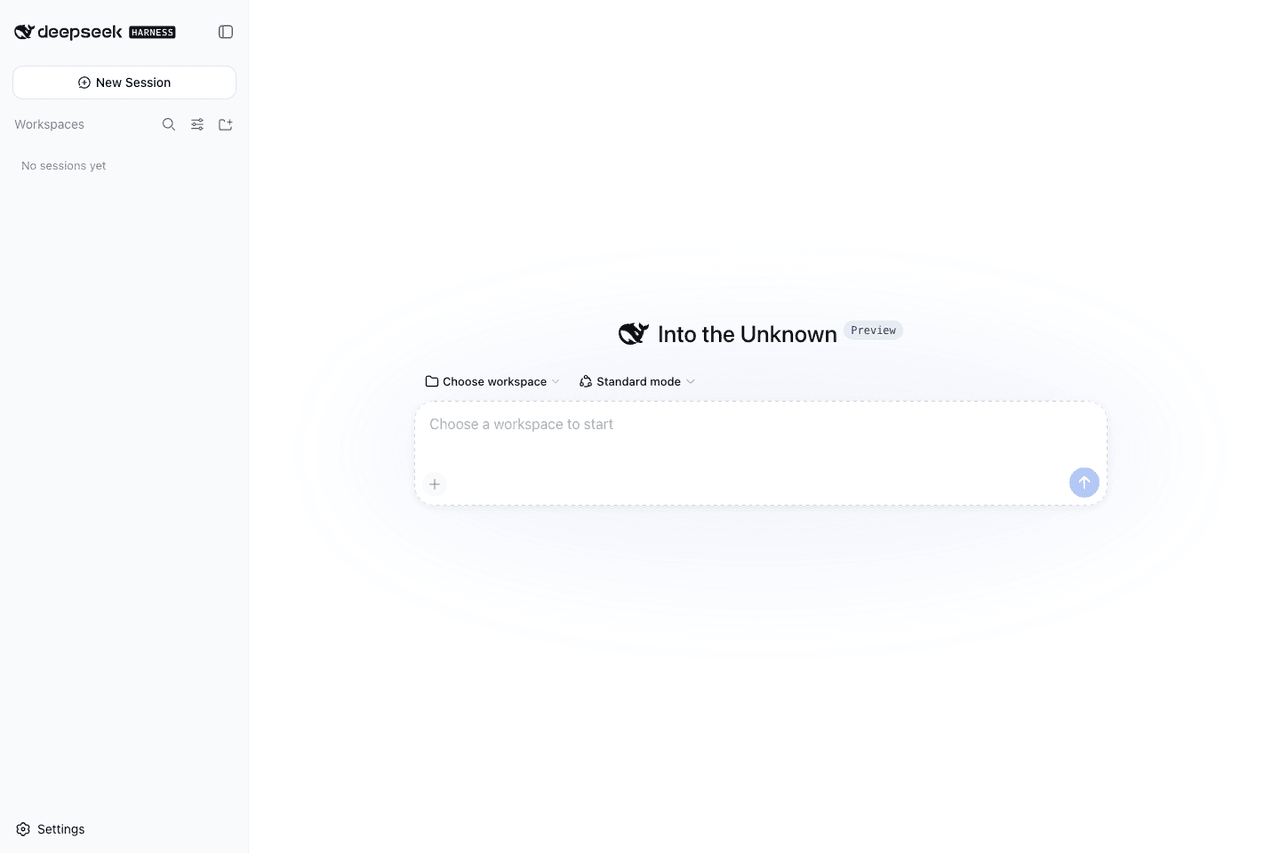 runzhliu/deepseek-harness-docker
Community Docker and Kubernetes packaging for DeepSeek Harness (@deepseek-ai/dsh), with a hardened image, Compose stack,…
runzhliu/deepseek-harness-docker
Community Docker and Kubernetes packaging for DeepSeek Harness (@deepseek-ai/dsh), with a hardened image, Compose stack,…
-
 labring/sealos-skills
AI agent skills for Sealos — deploy any project, provision databases, object storage & more with one command. Works with…
labring/sealos-skills
AI agent skills for Sealos — deploy any project, provision databases, object storage & more with one command. Works with…