jsdvjx/dsh-strata
Session strata for the DeepSeek Harness Web GUI: the transcript's scrollbar becomes a to-scale, colour-coded map of the whole run, with your own messages emphasised and clickable anchors.
项目介绍Project Overview
dsh-strata 是一款 DSH Web GUI 插件,用按真实渲染高度缩放的全景条带替换会话滚动条,将整段对话压缩成一张彩色全景图:蓝条标记你的发言、灰块代表模型回复、绿点为斜杠命令、琥珀色为重试或截断、红色为失败行;并以可点击锚点定位。适用于浏览超长 agent 会话时快速把握脉络与定位问题。注意:仅覆盖已加载窗口,Trajectory 页会收起,且占用约 14px 滚动条边距。
dsh-strata is a DSH Web GUI plugin that replaces the transcript scrollbar with a real-height proportional map of the loaded conversation, highlighting user messages in blue, model replies in grey, tool calls as thin ticks, and errors in red, with clickable anchors beside it. Use it to navigate long agent sessions and locate failures at a glance. It runs purely in the browser, only covers loaded history, and steps aside on the Trajectory tab.
请帮我了解并安装插件:【dsh-strata】【https://github.com/jsdvjx/dsh-strata】把上面这条消息直接发给当前会话里的 DSH,让它帮你了解并安装。安装命令不一定准确,发给 DSH 更稳。Send this message to DSH in your current session. CLI install commands may not be accurate across systems — DSH will figure it out for you.
或使用命令行安装(适合开发者)Or use CLI install (for developers)
命令行安装CLI Install
dsh plugin --profile web add dsh-strata把 jsdvjx/dsh-strata 加入你的 DSH 配置(web profile)即可启用。
READMEREADME
dsh-strata



Read the strata of a run.
English | 中文
A real minimap of the session trajectory for the DeepSeek Harness Web GUI — it takes the transcript's scrollbar seat and turns it into a scaled, colored picture of the whole loaded conversation, with your own messages emphasised and clickable anchors beside it.
Not a tick rail. Every other conversation navigator draws one evenly-spaced dot per prompt, which throws away the only thing a long agent session has too much of: volume. Here a band's height is the row's real rendered height, so the map is a proportional compression of the scroll extent — a 300-line answer looks like 300 lines, forty tool calls look like forty tool calls, and the viewport lens maps 1:1 onto the scrollbar. What you get is the shape of the run at a glance: where you spoke, how much work each prompt cost, and where it went wrong.
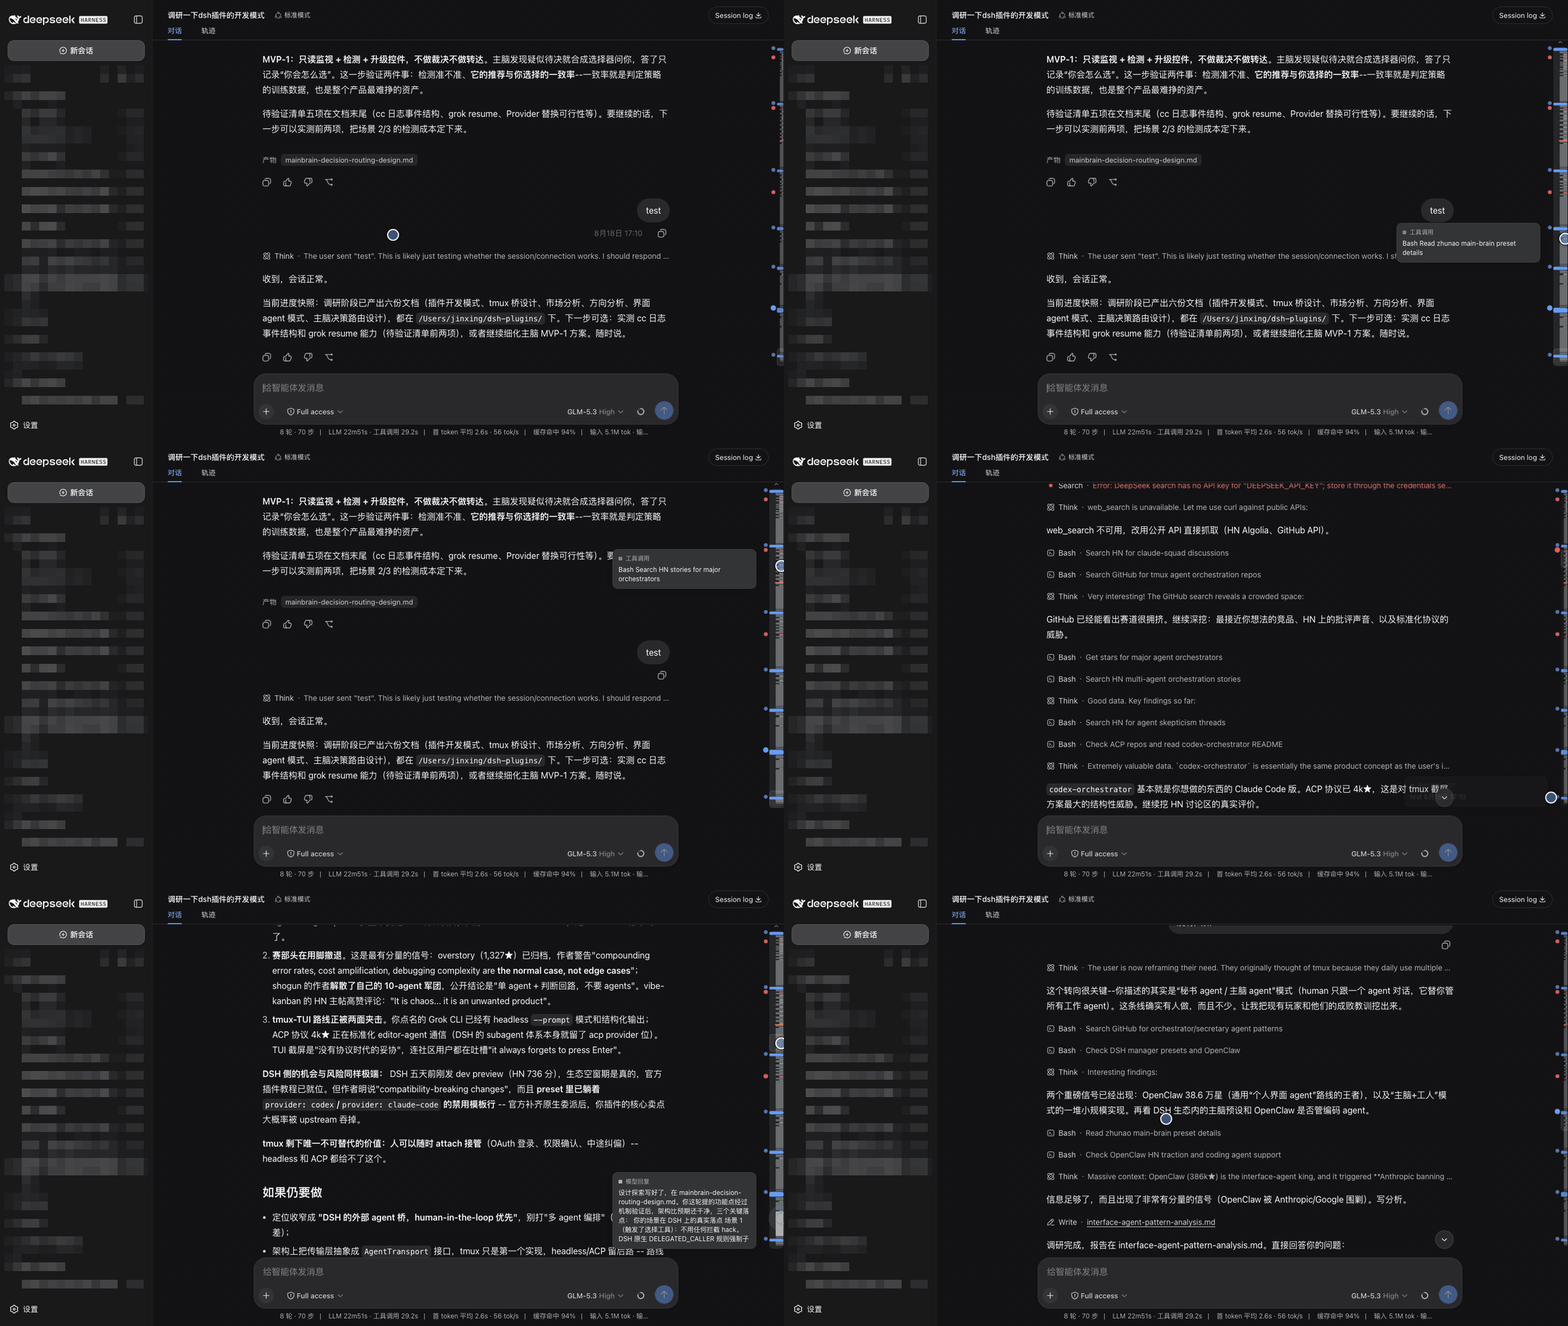
What the map shows
| Band | Meaning |
|---|---|
| Full-width blue | your message (and steering) — always the widest, brightest, never thinner than 5px |
| Grey block | a model reply; block height is how much it wrote |
| Thin grey tick | one tool call |
| Green | a slash command |
| Amber | a model retry, or a turn cut short by the output cap |
| Red | a failed turn — or any tool/command row that reported an error |
| Horizontal rule | a compaction checkpoint: where the model stopped seeing the history above |
| Rounded outline | the viewport lens (drag it) |
The ragged left edge is the index: every blue bar is a turn you started, and the block of agent work under it is what that turn cost.
It replaces the scrollbar
The rail sits in the transcript's own scrollbar gutter and the native thumb is suppressed while it is up, so there is one scroll control, not two — no layout shifts, because the gutter stays reserved either way. It is a takeover, not a theft: the moment the map stands down (Trajectory tab, no session, a transcript that does not scroll) the native scrollbar comes straight back, and uninstalling restores it permanently.
Anchors
Beside the rail is a column of clickable anchor dots — blue for every message you sent, red for every failed tool call or command. Click one to jump there. The dot for wherever you are reading stays enlarged, so the anchors double as a position indicator. Anchors that would collide collapse to keep the column readable; failures never collapse, since they are usually the reason you reached for the map.
The clue wall
Hovering a user anchor dot floats the clue wall over the right half of the screen: every user message in the session — including the ones above the loaded window (read from the session's own export log) — packed like an evidence board: every card takes exactly the size its content needs (a one-word prompt is a small slip, a long one a tall note), flowing into masonry columns so the whole session fits on one board whenever it can. Each card is tied to its anchor dot by a bezier that tracks live as the transcript scrolls; unloaded prompts get a dashed border, tag and dashed string, and the message you came from is spotlighted. Only when the board truly cannot hold everything do ↑/↓ pager buttons appear. Click a card to jump — an unloaded one chain-loads the missing history first. The wall retires when the pointer leaves it (grace period), or instantly on Esc; clicking a dot jumps straight to that message.
Map scale
A small 近 / 中 / 全 switcher sits under the rail while it is awake:
- 近 (initial) restores the view from when the session opened — however much history has been loaded since, the map keeps that scale and slides with your reading position;
- 中 (medium) spans twice the initial view, loading the difference on demand;
- 全 (full) maps everything — pulling in any unloaded history first, with the same rail progress bar the unloaded jump uses.
The choice persists per browser. Zoomed scales are pinned: loading more history shifts the window, never the scale.
Use
- Click an anchor dot to jump to that message or failure.
- Hover the rail — it widens and shows a preview card for the row under the cursor
(kind,
n/totalfor your own messages, and the row's text). - Click a band to scroll it into reading position; the row flashes when it lands.
- Click empty track or drag to scrub proportionally, like a scrollbar.
- Wheel over the rail or the dots to scroll the transcript.
- Keyboard: the rail is focusable — arrows nudge, PageUp/PageDown page,
Home/End jump to the ends (
role=scrollbarwith a livearia-valuenow). - Double-click to pin the rail open (persisted per browser).
- Older history loads by itself: scroll (or drag the lens) to the top and the transcript's
own load older fires, the map rescaling as history arrives. The faint
⌃above the rail just says there is more above; it retires once everything is loaded.
The map hides itself when there is nothing to navigate: no session, a transcript that does not scroll, or a non-chat view such as Trajectory.
Install
dsh plugin --profile web add dsh-strata
Or straight from the repo:
dsh plugin --profile web add "github:jsdvjx/dsh-strata#main"
Then restart dsh web. To remove:
dsh plugin --profile web remove dsh-strata
How it works
Pure browser half; the Node half is empty and no session data crosses the wire for it.
Geometry and semantics both come from anchors the conversation view already publishes —
[data-conversation-scroll] for the scrollport, [data-chat-anchor-key] per flow row,
data-chat-flow-kind for that row's registered Chat Node kind, data-state="error" for a
failed tool or command, [data-composer-seat] to stay clear of the sticky composer. It
contributes one entry to the frame-wide shell.overlay list slot, so it adds a surface
instead of replacing one, and uninstalling leaves the native UI untouched. The scrollbar
takeover uses the theme's documented seam — rebinding --dsh-scrollbar-thumb to
transparent on the scrollport, the same mechanism ui-sidebar uses — so both the WebKit
and Firefox rendering paths are covered and no stylesheet is overridden.
Rendering is a canvas repainted on a rAF, re-measuring rows only when the transcript
mutates or its scroll height changes — a plain scroll moves the lens and nothing else, so a
streaming turn does not drag layout through the map. Colors are read from the theme's own
--dsw-alias-* tokens, so light and dark both come out right, and prefers-reduced-motion
disables the transitions.
Limits
- The map covers the loaded window. DSH pages older history in on demand; until it is
loaded it has no layout to map. The
⌃indicator is the honest signal that more exists; reaching the top pulls it in automatically. - Chat view only. The Trajectory tab renders its own event ledger with different anchors; the map stands down there rather than guessing.
- The rail occupies a ~14px strip of the transcript's right padding, so clicks in that strip go to the map.
License
MIT
相关推荐Related
-
 ruvnet/ruflo
🌊 The original agent meta-harness. Deploy intelligent multi-player swarms, coordinate autonomous workflows, and build c…
ruvnet/ruflo
🌊 The original agent meta-harness. Deploy intelligent multi-player swarms, coordinate autonomous workflows, and build c…
-
 amruthpillai/reactive-resume
A one-of-a-kind resume builder that keeps your privacy in mind. Completely secure, customizable, portable, open-source a…
amruthpillai/reactive-resume
A one-of-a-kind resume builder that keeps your privacy in mind. Completely secure, customizable, portable, open-source a…
-
 volcengine/OpenViking
Self-evolving Context Database for AI Agents. Unify Agent Memory, Knowledge RAG and Skills.
volcengine/OpenViking
Self-evolving Context Database for AI Agents. Unify Agent Memory, Knowledge RAG and Skills.
-
 Molunerfinn/PicGo
:rocket: The Ultimate Image Uploader for Efficient Creators. Supports Obsidian, Typora, VS Code etc. and 60+ image hosti…
Molunerfinn/PicGo
:rocket: The Ultimate Image Uploader for Efficient Creators. Supports Obsidian, Typora, VS Code etc. and 60+ image hosti…
-
 titanwings/colleague-skill
将冰冷的离别化为温暖的 Skill,欢迎加入数字生命1.0!Transforming cold farewells into warm skills? It's giving rebirth era. Welcome to Digital …
titanwings/colleague-skill
将冰冷的离别化为温暖的 Skill,欢迎加入数字生命1.0!Transforming cold farewells into warm skills? It's giving rebirth era. Welcome to Digital …
-
 nocobase/nocobase
NocoBase is an open-source AI + no-code platform for building business systems fast. Instead of generating everything fr…
nocobase/nocobase
NocoBase is an open-source AI + no-code platform for building business systems fast. Instead of generating everything fr…
-
 Tencent/WeKnora
Open-source LLM knowledge platform: turn raw documents into a queryable RAG, an autonomous reasoning agent, and a self-m…
Tencent/WeKnora
Open-source LLM knowledge platform: turn raw documents into a queryable RAG, an autonomous reasoning agent, and a self-m…
- Nagi-ovo/voyager Enhancement suite for Gemini, AI Studio, Claude & ChatGPT — plus a prompt manager for any web UI, DeepSeek Harness inclu…