lxfu1/dsh-plugin-chart
DeepSeek Harness plugin that bundles the AntV chart visualization skill and a native chart-generation tool.
项目介绍Project Overview
dsh-plugin-chart 是 DeepSeek Harness 插件,可根据自然语言请求和提供的数据生成 AntV 图表并在对话中展示,支持折线、柱状、饼图、雷达、桑基、组织、网络、流程图等。需要把数据可视化时可用 /chart-visualization 显式调用。注意:提示词中的图表数据会发送到当前配置的图表服务,敏感信息应先聚合、匿名化或改用自有服务。
dsh-plugin-chart is a DeepSeek Harness plugin that creates AntV chart images from natural-language requests and supplied data, then displays them in the conversation. It supports line, bar, pie, radar, Sankey, organization, network, flow, and other chart types; use /chart-visualization to invoke it explicitly. Caveat: chart data in prompts is sent to the configured chart service, so aggregate or anonymize sensitive data or use your own compatible service.
请帮我了解并安装插件:【dsh-plugin-chart】【https://github.com/lxfu1/dsh-plugin-chart】把上面这条消息直接发给当前会话里的 DSH,让它帮你了解并安装。安装命令不一定准确,发给 DSH 更稳。Send this message to DSH in your current session. CLI install commands may not be accurate across systems — DSH will figure it out for you.
或使用命令行安装(适合开发者)Or use CLI install (for developers)
命令行安装CLI Install
npx @deepseek-ai/dsh plugin --profile web add github:lxfu1/dsh-plugin-chart把 lxfu1/dsh-plugin-chart 加入你的 DSH 配置(web profile)即可启用。
READMEREADME
dsh-plugin-chart
English | 简体中文
A plugin for DeepSeek Harness that creates AntV chart images directly from natural-language requests.
Provide the data and what you want to communicate. The plugin selects a suitable chart and displays the result in the conversation. Supported formats include line, bar, pie, radar, Sankey, organization, network, and flow charts.
Requirements
- Node.js
^22.19.0or>=24.0.0 - pnpm on
PATH - DeepSeek Harness
0.1.x
Install
Install directly from GitHub into the web profile:
npx @deepseek-ai/dsh plugin --profile web add github:lxfu1/dsh-plugin-chart
Git-hosted plugins build from source during installation. On pnpm 10 or later, the first command may ask you to allow the dsh-plugin-chart build in the profile's pnpm-workspace.yaml; follow the path printed by dsh, add the exact allowBuilds key reported by pnpm, and rerun the same command. Only grant build permission to source you trust.
Start the Web app:
npx @deepseek-ai/dsh web
Examples
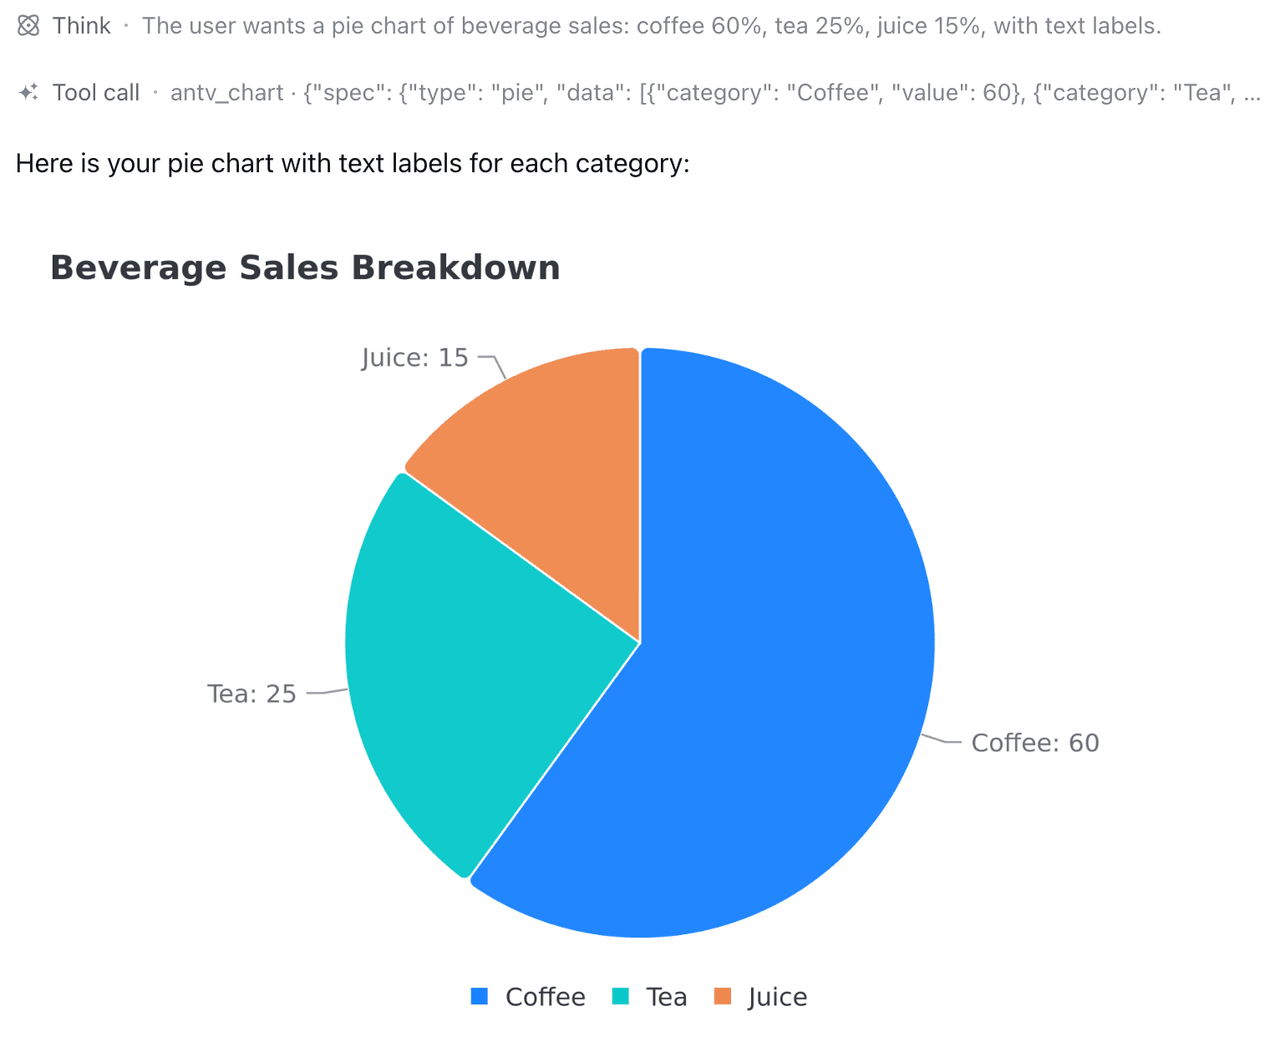
Pie chart
A coffee shop's beverage sales breakdown is: coffee 60%, tea 25%, and juice 15%.
Please visualize this beverage sales data using a pie chart and add corresponding text labels.
Organization chart
Please use AntV to generate an organizational chart titled "Xinghe Technology Organizational Structure," using a vertical layout.
Zhang Chen is the CEO, responsible for the company's overall strategy. The CEO oversees three centers:
1. Product Center, headed by Li Ran; subordinate to Wang Min (Product Design) and Chen Tao (User Growth).
2. Technology Center, headed by Zhou Yu; subordinate to Zhao Lei (Platform R&D) and Sun Yue (Data Intelligence).
3. Business Center, headed by Lin Lan; subordinate to He Feng (Enterprise Sales) and Zheng Xin (Customer Success).
Invoke the skill explicitly
To explicitly request the chart capability, enter:
/chart-visualization
The following are the monthly sales figures for various beverages at a chain coffee shop in 2025, in thousands of cups:
Coffee: January 128, February 135, March 142, April 150, May 163, June 178, July 192, August 188, September 176, October 169, November 158, December 151.
Tea: January 82, February 86, March 91, April 98, May 110, June 126, July 143, August 151, September 147, October 132, November 108, December 94.
Fruit Juice: January 45, February 48, March 55, April 68, May 92, June 126, July 158, August 171, September 149, October 103, November 66, December 50.
Seasonal Limited-Time Drinks: January 30, February 34, March 40, April 52, May 75, June 105, July 138, August 146, September 119, October 80, November 48, December 35.

Please use a multi-series line chart to display the annual sales trend of the four beverage categories. Set the chart title to "Monthly Sales Trend of Various Beverage Categories in 2025," with the horizontal axis representing months and the vertical axis representing sales volume (thousands of cups). Please use easily distinguishable colors for different beverages, display legends and data points, and retain the actual values for each month.
Supported charts
area, bar, boxplot, column, dual-axes, fishbone-diagram, flow-diagram, funnel, histogram, liquid, line, mind-map, network-graph, organization-chart, pie, radar, sankey, scatter, spreadsheet, treemap, venn, violin, waterfall, and word-cloud.
Data and privacy
Chart data from your prompt is sent to the currently configured chart service. Do not submit passwords, access tokens, private keys, government identifiers, full personal contact details, or unnecessary sensitive business records.
For sensitive data, aggregate or anonymize it first, or use your own compatible service. Image retention and access are governed by the selected service.
Remove
npx @deepseek-ai/dsh plugin --profile web remove dsh-plugin-chart
Development
pnpm install
pnpm check
License
MIT. Embedded content is adapted from AntV's chart-visualization skill. See THIRD_PARTY_NOTICES.md for attribution.
相关推荐Related
-
 nexu-io/open-design
🎨 Best DeepSeek Harness Design Plugin. The open-source Claude Design alternative. 🖥️ Local-first desktop app. 🖼️ Your…
nexu-io/open-design
🎨 Best DeepSeek Harness Design Plugin. The open-source Claude Design alternative. 🖥️ Local-first desktop app. 🖼️ Your…
-
 ruvnet/ruflo
🌊 The original agent meta-harness. Deploy intelligent multi-player swarms, coordinate autonomous workflows, and build c…
ruvnet/ruflo
🌊 The original agent meta-harness. Deploy intelligent multi-player swarms, coordinate autonomous workflows, and build c…
-
 amruthpillai/reactive-resume
A one-of-a-kind resume builder that keeps your privacy in mind. Completely secure, customizable, portable, open-source a…
amruthpillai/reactive-resume
A one-of-a-kind resume builder that keeps your privacy in mind. Completely secure, customizable, portable, open-source a…
-
 esengine/DeepSeek-Reasonix
DeepSeek-native AI coding agent for your terminal. Engineered around prefix-cache stability — leave it running.
esengine/DeepSeek-Reasonix
DeepSeek-native AI coding agent for your terminal. Engineered around prefix-cache stability — leave it running.
-
 volcengine/OpenViking
Self-evolving Context Database for AI Agents. Unify Agent Memory, Knowledge RAG and Skills.
volcengine/OpenViking
Self-evolving Context Database for AI Agents. Unify Agent Memory, Knowledge RAG and Skills.
-
 Molunerfinn/PicGo
:rocket: The Ultimate Image Uploader for Efficient Creators. Supports Obsidian, Typora, VS Code etc. and 60+ image hosti…
Molunerfinn/PicGo
:rocket: The Ultimate Image Uploader for Efficient Creators. Supports Obsidian, Typora, VS Code etc. and 60+ image hosti…
-
 titanwings/distilly
Distilly — Distill how they think into reusable Skills for any Agent or Bot. Formerly Colleague Skill(原同事 Skill).
titanwings/distilly
Distilly — Distill how they think into reusable Skills for any Agent or Bot. Formerly Colleague Skill(原同事 Skill).
-
 titanwings/colleague-skill