maddogfinance/dsh-trading
交易研究工作台插件:数据接缝 · 确定性指标 · 交互式K线卡
项目介绍Project Overview
dsh-trading 是一组面向 DeepSeek Harness 的交易研究插件,遵循 MIT 协议。它由八个包组成,核心能力是通过工具、行情数据接口与可复用的渲染层,把行情快照、K 线、标注与多时间周期指标等流程串起来;网页端还提供可交互的图表卡片以及由用户驱动的实时图表列与对话联动。适合在 dsh 的 web 或 headless 配置上叠加使用,做多时间周期市场分析。需要注意的是项目仍处于早期脚手架阶段,依赖 dsh 的开发者预览版,可能存在破坏性变更。
dsh-trading is a bundle of research-oriented plugins for DeepSeek Harness, distributed under MIT. It wires together market data, model-facing tools, and reusable renderers so the agent can fetch OHLCV snapshots, annotate charts with provenance, and read the user's own live chart via a loopback channel. On the web profile, market_snapshot and get_ohlcv results render as interactive candlestick cards with chip-toggled indicator panes, and the optional chart-first shell pins a live column that the conversation follows. It is an early scaffold against dsh's developer preview, so expect breaking changes on either side.
请帮我了解并安装插件:【dsh-trading】【https://github.com/maddogfinance/dsh-trading】把上面这条消息直接发给当前会话里的 DSH,让它帮你了解并安装。安装命令不一定准确,发给 DSH 更稳。Send this message to DSH in your current session. CLI install commands may not be accurate across systems — DSH will figure it out for you.
或使用命令行安装(适合开发者)Or use CLI install (for developers)
命令行安装CLI Install
dsh plugin --profile trading add @dsh-trading/bundle把 maddogfinance/dsh-trading 加入你的 DSH 配置(web profile)即可启用。
READMEREADME
dsh-trading
A trading research workbench built as plugins for DeepSeek Harness (dsh). No fork, no patched core — just a bundle you stack on the stock web or headless profile.
Status: early scaffold. dsh itself is in developer preview and moves fast; expect breaking changes on both sides.
The workbench
Under dsh web with the optional shell frame, the app becomes chart-first: a
persistent, live chart column on the left, the conversation on the right.
┌──┬────────────────────────────────────┬─────────────────────────┐
│  │  CC.BTCUSDT   1m 5m [15m] 1h 1d    │  ⌄ Market Analyst       │
│▸ │  ┌──────────────────────────────┐  │                         │
│  │  │        ╱╲    ╱╲              │  │  MU is coiling under    │
│s │  │  ╱╲   ╱  ╲__╱  ╲_ ── 118,400 │  │  118.4k; the 15m ADX …  │
│e │  │ ╱  ╲_╱          ╲ ── 116,900 │  │                         │
│s │  │▁▂▃▁▂▄▃▁▂▃▅▂▁▃▂▁▄▃▁▂▃         │  │  ▸ annotate_chart       │
│s │  └──────────────────────────────┘  │    ✎ 6 marks — Show     │
│  │  ● live · 15m · 5:05:10 PM   📌    │                         │
└──┴────────────────────────────────────┴─────────────────────────┘
   rail        the chart you drive          the agent you talk to
The column is yours: type a symbol, pick a timeframe, and it fetches over a loopback channel without going through the model at all. It also follows the conversation — when the agent charts something, the column loads that instrument live rather than mirroring the agent's frozen snapshot. Touching the chart at all — a symbol, a timeframe — pins it, and a 📌 chip says so; from then on the agent's drawings arrive as a Show offer on a pill instead of taking the chart out from under you. Click the chip to start following again.
Drawings work the same way in both directions. annotate_chart levels, zones
and paths land on the live column; the prose half of the same analysis —
the level table, the bull/bear scenario cards — stays in chat, where reading
text belongs. And the loop closes: the panel publishes what it is showing back
to the host, so the agent can read your chart (get_chart_view, plus a
one-line context injection each turn) instead of asking you to screenshot it.
Demo
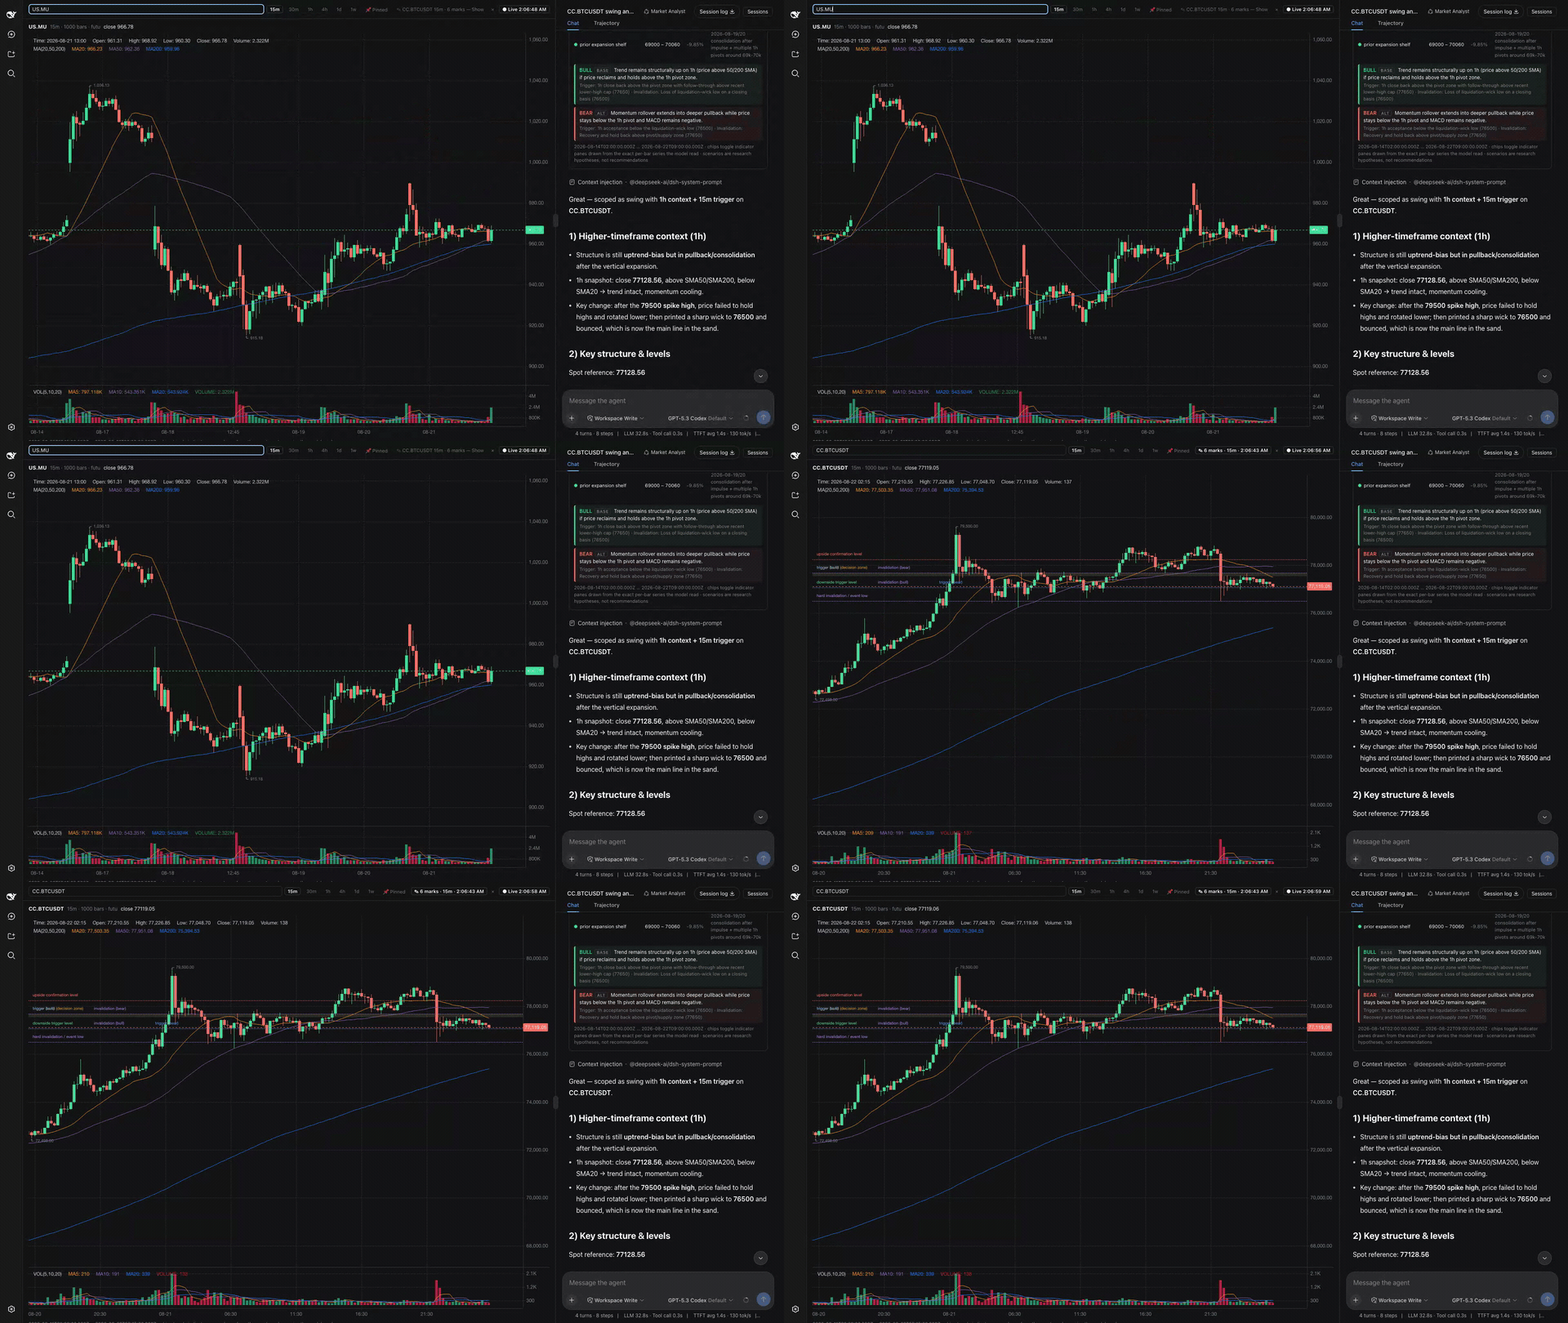
The column is pinned to Micron. The agent's six marks are for Bitcoin — a different instrument, so the predicate refuses the merge and nothing lands on the wrong chart. They are offered on a pill instead; one click loads that chart with its marks. The clock in the top-right corner is a live feed off a local OpenD, ticking through the whole clip.
▶ Watch the full 90-second demo with narration — the loop above is one beat of it. The full cut also walks the shell, the symbol box and the timeframe row, the agent drawing on the live column, and the per-turn context line that lets it read your chart without asking for a screenshot.
None of it is a mockup: the footage is 1920x1080 Playwright captures of a real session against a live Futu OpenD, and the chart keeps ticking through every shot.
The earlier v0.2 demo — chart cards in the chat feed
▶ 80-second demo with narration on YouTube
Recorded before the chart-first shell existed, and still exactly how the web
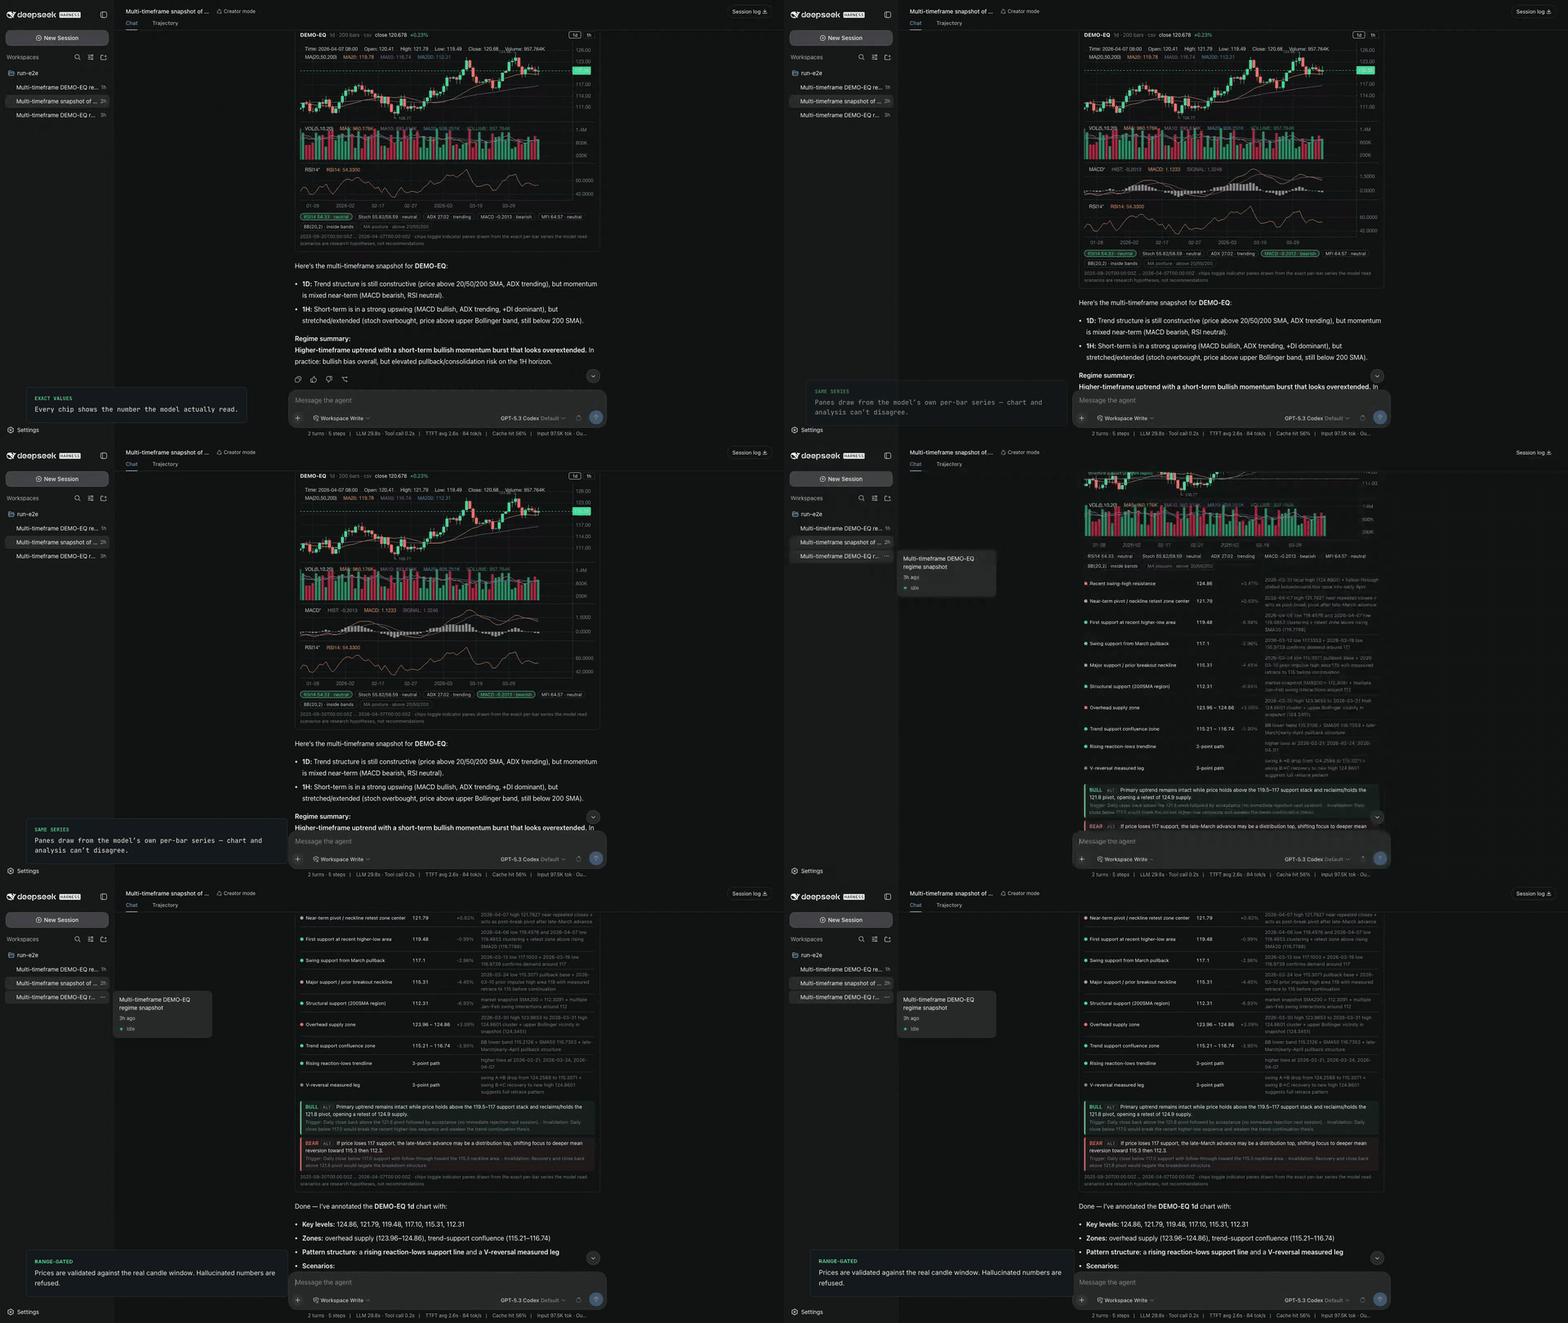
surface behaves without @dsh-trading/client-frame: the agent answers with
an interactive chart card, chips draw indicator panes from the exact per-bar
series the model read, and annotate_chart puts levels on the chart through a
trust gate — mandatory provenance, prices validated against the real candle
window.
Design
Eight packages, one direction of dependency:
@dsh-trading/tool-market      model-facing tools (list_symbols, get_ohlcv,
                              market_snapshot, annotate_chart, render_chart)
                              + the indicator library
        │  consumes
        ▼
@dsh-trading/market-data      the seam: ctx.marketData — typed candle/symbol interface
        ▲  implements
        │
@dsh-trading/provider-csv     reference provider: local CSV files
@dsh-trading/provider-futu    live provider: HK / US / A-share equities and
                              24/7 crypto pairs, from a local Futu OpenD

@dsh-trading/risk-guard       independent: refuses execution-shaped tool names
                              from any plugin, at dsh's tools/pre-execute gate

@dsh-trading/verdict          the evaluation harness: audit_backtest validates
                              fills against real candles, runs a seeded
                              random baseline and sample-size power check;
                              lint_strategy_code hunts lookahead leaks.
                              Verdicts may honestly be NOT PROVEN.

@dsh-trading/client-chart     web-only cards + the persistent chart column and
                              the loopback channel that feeds it; host-side,
                              the get_chart_view tool and the per-turn
                              context line that let the agent read that column
        │  fills the chart seat of
        ▼
@dsh-trading/client-frame     web-only: the shell frame. Replaces dsh's stock
                              three-column layout row with a chart-first one —
                              sidebar | chart | conversation | details,
                              70/30 by default with the sidebar railed — and
                              declares the `trading.chart` seat
market-datadefines the seam and nothing else (its only peer is cordis). Every consumer talks toctx.marketData; every data source hides behindMarketDataProvider.provider-csvis the bring-your-own-data template: ~100 lines, local<root>/<symbol>/<timeframe>.csvfiles. Copy it to put ClickHouse, a broker API, or CCXT behind the same interface — tools upstream never change.provider-futuis that template filled in against a real broker gateway: HK / US / A-share equities and crypto pairs (CC.BTCUSDT), the last being the only instrument that keeps moving at 3am, which makes it the honest way to check that "live" is live. It readsQot_GetKLrather thanQot_RequestHistoryKLon purpose: GetKL rides the subscription quota and serves the most recent bars (≤1000), while RequestHistoryKL spends a scarce historical quota OpenD rations by account assets. The trade is stated in the provider's owndescriptionand honoured in its behaviour —start/endfilter the fetched window, they do not seek, so a query for an older range returns honestly empty rather than quietly wrong. See Live data for setup; note that OpenD is an account-bound personal gateway, which is a licensing fact, not a configuration one.futu-apiis a peer dependency, deliberately unpinned. The SDK's version is coupled to the OpenD you have installed, not to this package, and Futu states outright that its package versions follow its own scheme rather than semver — so no range expresses "compatible" and the two must be aligned by hand. Install thefutu-apimatching your OpenD (10.9.xSDK for a10.9.xOpenD). The provider checks this itself at connect, viaGetGlobalState, and logs a warning naming both versions if the protocol lines differ — a skew otherwise surfaces as a rejected handshake or an empty decode, with nothing to point at.tool-marketregisters read-only analysis tools onctx.tools.market_snapshotreturns a whole multi-timeframe indicator regime in one call (RSI, slow stochastic, ADX/DI, MACD, MFI, ATR, SMA/EMA posture, Bollinger) with coarse state labels;get_ohlcvserves raw bars when structure matters. The indicator math is pure and deterministic — textbook definitions with Wilder smoothing where Wilder defined it — so values reconcile against any charting platform and a session-log replay recomputes identical model-visible numbers.client-chartdraws the charts, and drives them from two independent ends. The model'smarket_snapshot/annotate_chartresults render as cards through thetool.call.toolviewseam. The USER drives the persistent column directly: a symbol box and timeframe row talk toctx.marketDataover a loopback RPC channel the package's host half publishes. That second path is the point — a workbench whose only input is "hope the agent calls the right tool" stops working the moment the agent would rather chat, which is exactly what happens in practice. The channel exposes the two read verbs ofMarketDataProviderplus one write that only records what the panel is showing; it never touches the tool layer, so risk-guard's execution gate is neither weakened nor bypassed.The column follows the conversation rather than mirroring it. When the agent charts an instrument the panel loads that symbol and timeframe for itself — adopting the agent's payload verbatim would pin a frozen ≤200-bar snapshot on screen, which is precisely the "why isn't it moving?" bug this replaced. It refuses to refetch a series it already holds (one analysis calls
annotate_chartdozens of times on the same chart), and a pinned column stops following entirely: the agent's chart becomes aShowoffer on a pill, not a takeover mid-read. The decision is a pure function with its own test suite, because a policy buried in auseEffectis a policy nobody can pin.Marks ride separately from candles. The agent's drawings are matched to the panel's series by a strict predicate — same instrument, same timeframe, prices inside the visible range — so a level drawn on the 1h chart never silently appears on the 5m one, and marks that fall outside are reported as dropped rather than clamped. They survive a reload via per-tab
sessionStorage, since the card that published them may be virtualized away by the time the page comes back. Captions are laid out in three lanes with a minimum gap so ten levels inside a narrow band read as ten levels instead of one smear; past three collisions the line still draws and the caption is dropped.The panel also publishes what it is showing back to the host, and the host feeds that to the model two ways: a one-line context injection each turn, and a
get_chart_viewtool for the same facts on demand. This closes a loop that was conspicuously open — the panel's data path bypasses the tool layer by design, so nothing about the user's chart reached the agent on its own, and the agent would ask the user to screenshot a chart it was rendering two columns away. The injection costs nothing while the panel is idle (empty text is no contribution), the published value is validated on arrival (it lands in a model's context, which makes it a prompt-injection surface as much as a correctness one), and it expires after 30s so an abandoned second tab cannot make the model confidently name the wrong symbol.The chart stays live: it re-reads the last few bars once a second and merges them by open time, so a forming bar is replaced in place and a new one is appended — append blindly and a live chart grows a duplicate candle every poll. Updates go through
updateDataon the existing plot rather than a rebuild, so the canvas never flickers. A poll rather than a push, deliberately: the host channel is unary, and a chart seconds old is worth far less engineering than a streaming transport. When the tape stops moving — eight polls that taught it nothing — the panel backs off to once every five seconds and springs back the moment a bar moves, which is cheaper and more honest than shipping a market calendar. A hidden tab backs off the same way rather than stopping: some embedded browsers reporthiddenwhile the user is plainly watching, and a kill-switch there is indistinguishable from the bug it looks like.client-frameis the layout half of the same row-swap idea. dsh's shell is one plugin row (ui-layout) that occupies the built-inrootslot and declares thesidebar/conversation/details/shell.overlayseats inside it. Slot core permits exactly one declarer per seat, so a frame cannot sit beside the stock one — the bundle disables that row and inserts ours, which re-declares those four seats under the same names.ui-sidebarandui-conversationregister by name, so dsh's real sidebar and its real conversation surface mount into a third-party frame unchanged; we only decide the column order. On top of them it adds a fifth seat,trading.chart, for the persistent chart column.Its defaults differ from the stock shell on purpose. The chart takes 70% of the free width and the conversation 30 — stored as a ratio, not a pixel width, because "the chart takes 70%" has to survive a window resize to mean anything. The conversation floor drops from dsh's 640px to 420, since here it is a side column rather than the whole app; holding 640 would make the split impossible on a laptop. The sidebar starts collapsed to its rail: a permanent session-history column is a poor trade against chart width, so the frame contributes a session switcher to
conversation.session.header.utilitiesinstead — the route to your sessions lives in the conversation's own top-right, next to the thing it switches. No fork, no patched core — the same mechanism as swappingmarket-data-provider.Opt-in, not bundled. This row is deliberately absent from
@dsh-trading/bundle: replacing the whole shell is far too opinionated to impose on everyone who installs the bundle. Add it from your own profile patch when you want it:- id: ui-layout disabled: true - insert: - id: trading-frame name: '@dsh-trading/client-frame'bundle/tradingwires six rows into a dsh profile viacordis.patch.yml:market-data,market-data-provider,tool-market,verdict,risk-guard,client-chart. Users repoint or replace themarket-data-providerrow from their own profile patch — that row swap is the BYO mechanism. The shell frame and the Futu provider are deliberately not among those rows; see above for the lines that enable each.
Why this and not another finance plugin?
Data plugins hard-wire one source; dsh-trading defines the seam they can all plug
into. Quant toolkits ship one tool per indicator; market_snapshot returns the
whole multi-timeframe regime in one call, with state labels computed from the
rounded reported values so chart and number never disagree. And everyone else's
"research only" is a README sentence — ours is a tools/pre-execute gate you can
test.
Hard boundary: research only
This project deliberately has no order-execution capability and no execution seam. Tools read data and compute; nothing places, routes, or simulates-then-forwards orders. Contributions adding live trading execution are out of scope. Nothing here is investment advice.
@dsh-trading/risk-guard extends that stance over plugins this project does not ship: it refuses order-execution and fund-movement tool names at dsh's tools/pre-execute gate, so mounting a broker plugin in a trading profile does not quietly gain the ability to trade. Name matching is a heuristic and cannot be complete — the guard is defense in depth, not the guarantee. The guarantee is structural: there is no execution seam to reach.
Data format (CSV provider)
data/
  AAPL/
    1d.csv        # header: time,open,high,low,close,volume
  BTC-USDT/
    1h.csv        # ISO-8601 UTC bar-open times, ascending
Try it with dsh
One command — the published bundle pulls its six plugin rows from npm
(client-frame and provider-futu are opt-in, see below):
dsh plugin --profile trading add @dsh-trading/bundle
Or from a checkout (for hacking on the packages)
Build, then compose the profile from local paths. dsh resolves plugin rows from the profile directory, so every package the bundle's patch names must be linked alongside it — miss one and that row fails to resolve at boot:
pnpm install && pnpm build
node examples/generate-sample-data.mjs

dsh plugin --profile trading add ./bundle/trading \
    ./packages/market-data ./packages/provider-csv ./packages/tool-market \
    ./packages/verdict ./packages/risk-guard ./packages/client-chart
Add ./packages/client-frame and ./packages/provider-futu to that list if
you intend to enable the chart-first shell or live Futu data.
Add "@deepseek-ai/dsh-headless" (or "@deepseek-ai/dsh-web-app") after
@deepseek-ai/dsh-base in the profile's dsh.profile.bundles list
($DSH_HOME/profiles/trading/package.json) to pick a surface, configure a model
key (environment DEEPSEEK_API_KEY, or the Models page under dsh web), and
run from any directory whose ./data holds candles in the layout above:
cd examples && dsh --profile trading "pull DEMO-EQ daily candles with sma20/sma50 and describe the trend"
Verify the composed layers any time with dsh --profile trading --dump-config.
Live data: Futu OpenD
Install and run Futu OpenD with its
websocket listener enabled — that is a separate port from api_port, and
websocket_key_md5 is mandatory for JavaScript clients (without it OpenD
answers the handshake with a bare retType: -1 and no message). In
OpenD.xml / OpenD.ini:
websocket_port = 33333
websocket_key_md5 = <md5 of your key>
Then install the matching SDK and repoint the provider row from your profile's
cordis.patch.yml:
npm i futu-api@10.9 # must match your OpenD's version line
- id: market-data-provider
  name: '@dsh-trading/provider-futu'
  config:
    host: 127.0.0.1
    port: 33333       # the websocket port — NOT api_port (11111)
    symbols:
      - CC.BTCUSDT    # crypto: the one that moves 24/7
      - HK.00700
      - US.MU
symbols is the catalogue list_symbols reports; any symbol OpenD knows can
still be typed straight into the chart column.
The Market Analyst preset
presets/analyst/ is an agent preset that turns the raw tools into a structured
analysis workflow: it scopes the request first (horizon, focus, timeframes),
then reports higher-timeframe context, a key-level table, the multi-timeframe
indicator regime with conflicts named rather than averaged away, bull and bear
scenarios with triggers and invalidation, and the levels that resolve the
ambiguity. Install it and pick Market Analyst in the session's preset menu:
DSH="${DSH_HOME:-$HOME/.dsh}"
mkdir -p "$DSH/.agent-presets" && cp -r presets/analyst "$DSH/.agent-presets/"
The persona holds the research boundary in prose the way risk-guard holds it
in code: report what the data shows, never recommend a position or an entry.
It also decides where an analysis lands — annotate_chart draws on the
reader's live column, and render_chart is reserved for exporting an image
file. Getting that one paragraph wrong is what put drawings in the chat feed
instead of on the chart.
Chart cards in dsh web
Under the web surface, market_snapshot and get_ohlcv results render as
interactive candlestick cards (@dsh-trading/client-chart): K-line + volume +
SMA20/50/200, timeframe tabs, and a chip strip that both shows the exact
indicator values the model read and toggles panes for them (RSI, slow
stochastic, ADX/DI, MACD, MFI, plus Bollinger as a price overlay). Every pane
is plotted from the same per-bar series the model was given, not recomputed
in the browser — which is why the card can never contradict the analysis text
beside it. The chart data rides the durable tool/result event's presentation
metadata: it never enters the model's context (zero token cost) and it replays
with the session log.
The card renderers are web-only; under a headless profile dsh falls back to the
generic text card and the loopback channel never appears. The host half is not
inert there, though — get_chart_view and the per-turn context line register
wherever ctx.tools and ctx.systemPrompt exist, and simply report a closed
panel.
Development
pnpm install
pnpm typecheck
pnpm build
pnpm test
Roadmap
- Profile template + docs for stacking onto
dsh --profile web - Chart cards in
dsh web(@dsh-trading/client-chart):market_snapshot/get_ohlcvrender as interactive candlesticks with chip-toggled indicator panes -
annotate_chart: model-authored levels/zones/paths with mandatory provenance and a hard price-range gate, plus base/alternative scenarios — rendered on the card with a levels table - Open contracts for ecosystem builders (CONTRACTS.md): chart payload, open annotation envelope, pure-renderer registry
- Chart-first shell (
@dsh-trading/client-frame) and a persistent live column the user drives, with the agent's drawings landing on it - Chart panel deepening: user-drawing feedback to the agent,
@Remotehost service for pan-back data - Watch/alert contract (notify-only),
@dsh-trading/contractspackage, conformance fixtures - Research-journal session events (hypotheses, signals — replayable)
- Deterministic backtest runner as a
ctx.commandsCLI command (never model-executed) - More providers: Parquet, ClickHouse, CCXT
License
MIT
相关推荐Related
-
 nexu-io/open-design
🎨 Best DeepSeek Harness Design Plugin. The open-source Claude Design alternative. 🖥️ Local-first desktop app. 🖼️ Your…
nexu-io/open-design
🎨 Best DeepSeek Harness Design Plugin. The open-source Claude Design alternative. 🖥️ Local-first desktop app. 🖼️ Your…
-
 ruvnet/ruflo
🌊 The original agent meta-harness. Deploy intelligent multi-player swarms, coordinate autonomous workflows, and build c…
ruvnet/ruflo
🌊 The original agent meta-harness. Deploy intelligent multi-player swarms, coordinate autonomous workflows, and build c…
-
 amruthpillai/reactive-resume
A one-of-a-kind resume builder that keeps your privacy in mind. Completely secure, customizable, portable, open-source a…
amruthpillai/reactive-resume
A one-of-a-kind resume builder that keeps your privacy in mind. Completely secure, customizable, portable, open-source a…
-
 esengine/DeepSeek-Reasonix
DeepSeek-native AI coding agent for your terminal. Engineered around prefix-cache stability — leave it running.
esengine/DeepSeek-Reasonix
DeepSeek-native AI coding agent for your terminal. Engineered around prefix-cache stability — leave it running.
-
 volcengine/OpenViking
Self-evolving Context Database for AI Agents. Unify Agent Memory, Knowledge RAG and Skills.
volcengine/OpenViking
Self-evolving Context Database for AI Agents. Unify Agent Memory, Knowledge RAG and Skills.
-
 Molunerfinn/PicGo
:rocket: The Ultimate Image Uploader for Efficient Creators. Supports Obsidian, Typora, VS Code etc. and 60+ image hosti…
Molunerfinn/PicGo
:rocket: The Ultimate Image Uploader for Efficient Creators. Supports Obsidian, Typora, VS Code etc. and 60+ image hosti…
-
 titanwings/distilly
Distilly — Distill how they think into reusable Skills for any Agent or Bot. Formerly Colleague Skill(原同事 Skill).
titanwings/distilly
Distilly — Distill how they think into reusable Skills for any Agent or Bot. Formerly Colleague Skill(原同事 Skill).
-
 titanwings/colleague-skill