
Starlight-bananice/dsh-status-bar
一眼看清你的 agent 正在做什么——适用于 DeepSeek Harness 的 17 段可配置状态栏:状态/模型/上下文/令牌/TPS/成本/任务。
项目介绍Project Overview
dsh-status-bar 是一款 DSH 插件,用 17 段可配置状态栏替代原生单行统计栏,实时显示状态、模型、上下文压力、Token 与吞吐(TPS)、单条按模型计费的费用、任务与队列,支持两键开关/重排、多行换行与中英界面。适合长时间使用 DSH、想边写边看会话指标的用户。注意:DSH 版本须为 0.1.0-rc.7,stateVersion 需与同宿主中其他 liveTokenUsage 提供者一致,否则本插件会跳过注册并共用对端单元。
dsh-status-bar is a DSH plugin that replaces the built-in single-line stats cell with a 17-segment configurable bar showing status, model, context pressure, tokens, live TPS, per-model cost estimates, jobs, and queue. Segments toggle and reorder in two clicks, with multi-line wrapping, peak/off-peak pricing, CNY/USD currency, and a bilingual EN/ZH UI. It cleanly shadows the native line and restores it on unload. Use it when running DSH daily and needing live session telemetry without a separate monitor. Caveat: requires DSH 0.1.0-rc.7, Node 22+, and matching stateVersion with any coexisting liveTokenUsage peer.
请帮我了解并安装插件:【dsh-status-bar】【https://github.com/Starlight-bananice/dsh-status-bar】把上面这条消息直接发给当前会话里的 DSH,让它帮你了解并安装。安装命令不一定准确,发给 DSH 更稳。Send this message to DSH in your current session. CLI install commands may not be accurate across systems — DSH will figure it out for you.
或使用命令行安装(适合开发者)Or use CLI install (for developers)
命令行安装CLI Install
dsh plugin --profile web add @bananiceee/dsh-status-bar把 Starlight-bananice/dsh-status-bar 加入你的 DSH 配置(web profile)即可启用。
READMEREADME
dsh-status-bar · Know what your agent is doing — at a glance
The native DeepSeek Harness bottom status bar packs everything into one long line — so much that parts of it get truncated on narrow windows. dsh-status-bar brings a near-native status-bar experience: a fully configurable 17-segment bar showing exactly the content you want — status, model, context pressure, token burn, real-time generation speed, cost estimates, jobs and queue — toggled and reordered in two clicks, with useful options like multi-line wrapping and per-model cost estimation. It replaces the built-in stats line and removes itself cleanly when unloaded.





Overview
The problem: the native DSH bottom status bar is one long, fixed line — the more it shows, the more it overflows, and on narrow windows parts of it get truncated. You cannot see the current model, how full the context window is, how fast tokens are streaming, or what a session has cost — and there is no way to arrange that information the way you work.
Who it is for: power users and teams running DSH daily — anyone who wants live session telemetry without leaving the composer, and without running a separate monitor.
What it does:
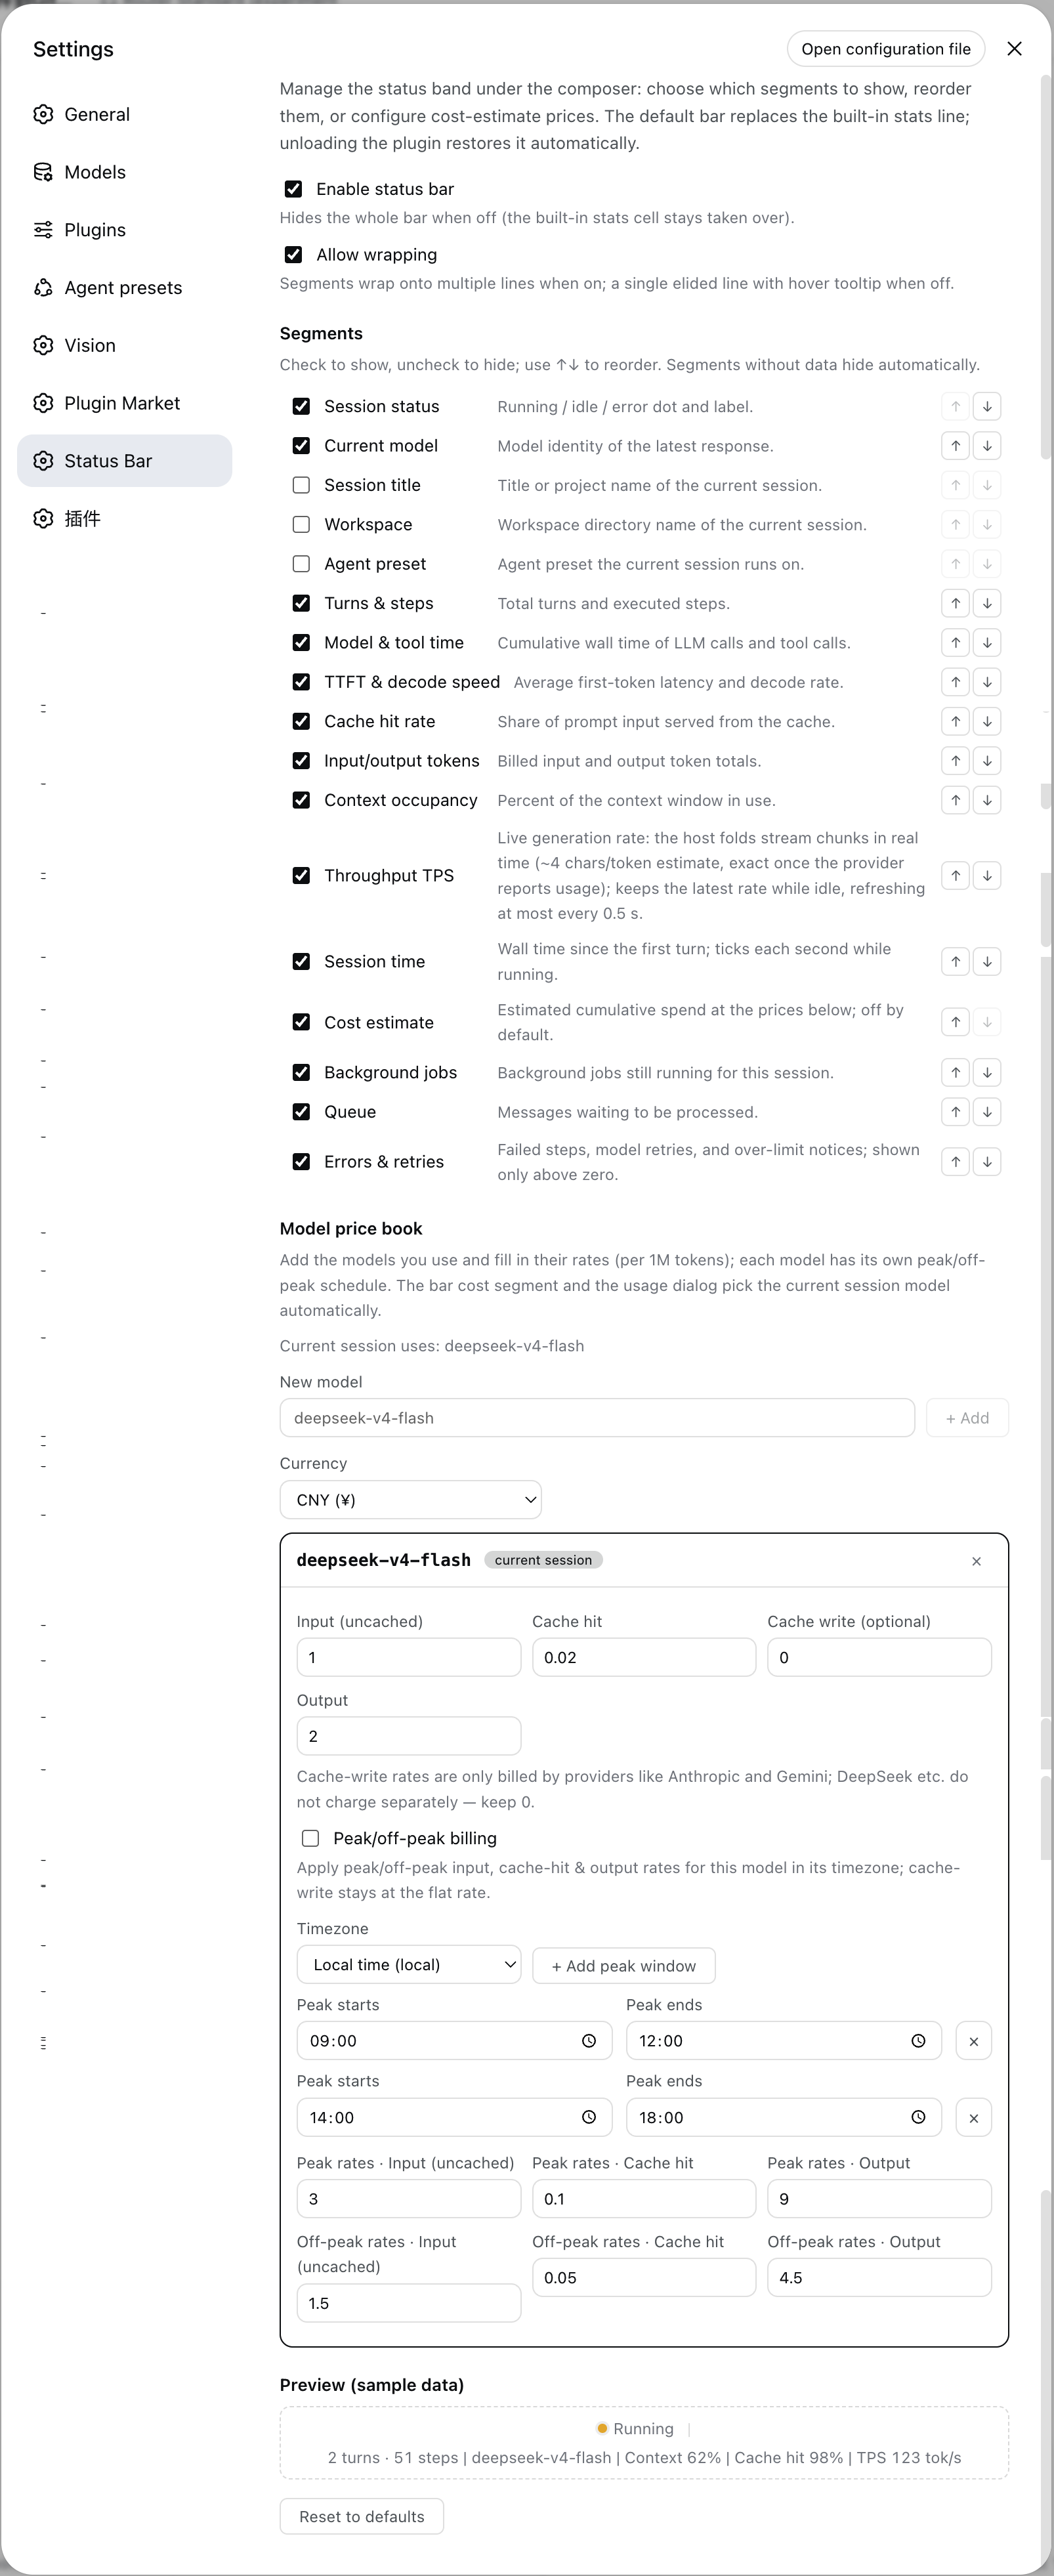
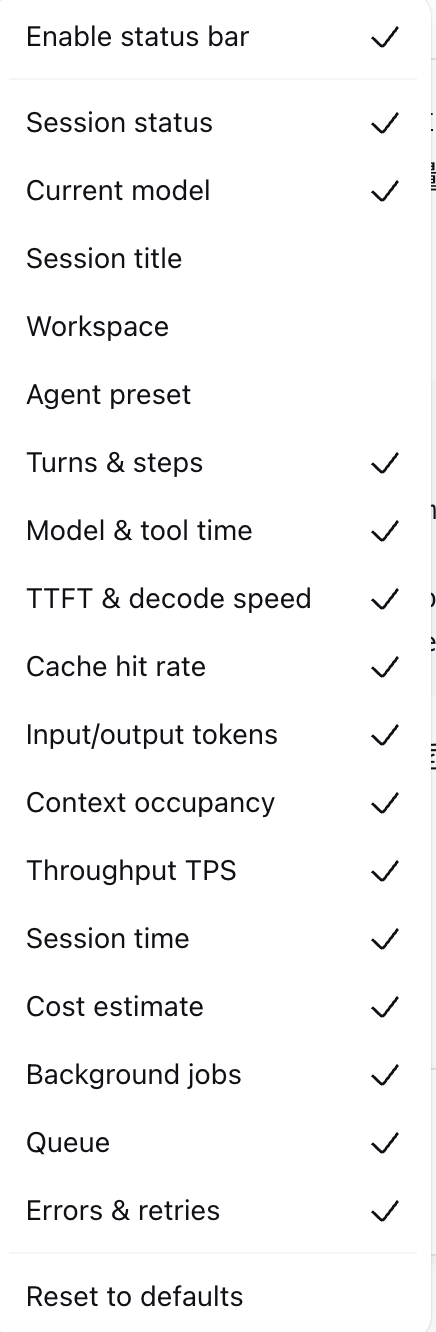
- Near-native experience, fully yours — 17 toggleable, reorderable segments: status dot, model, title, workspace, agent preset, turns & steps, model/tool time, TTFT & decode speed, cache-hit rate, tokens, context pressure, live TPS, session time, cost estimate, jobs, queue, errors
- Live throughput (TPS) — a host-side projection folds every
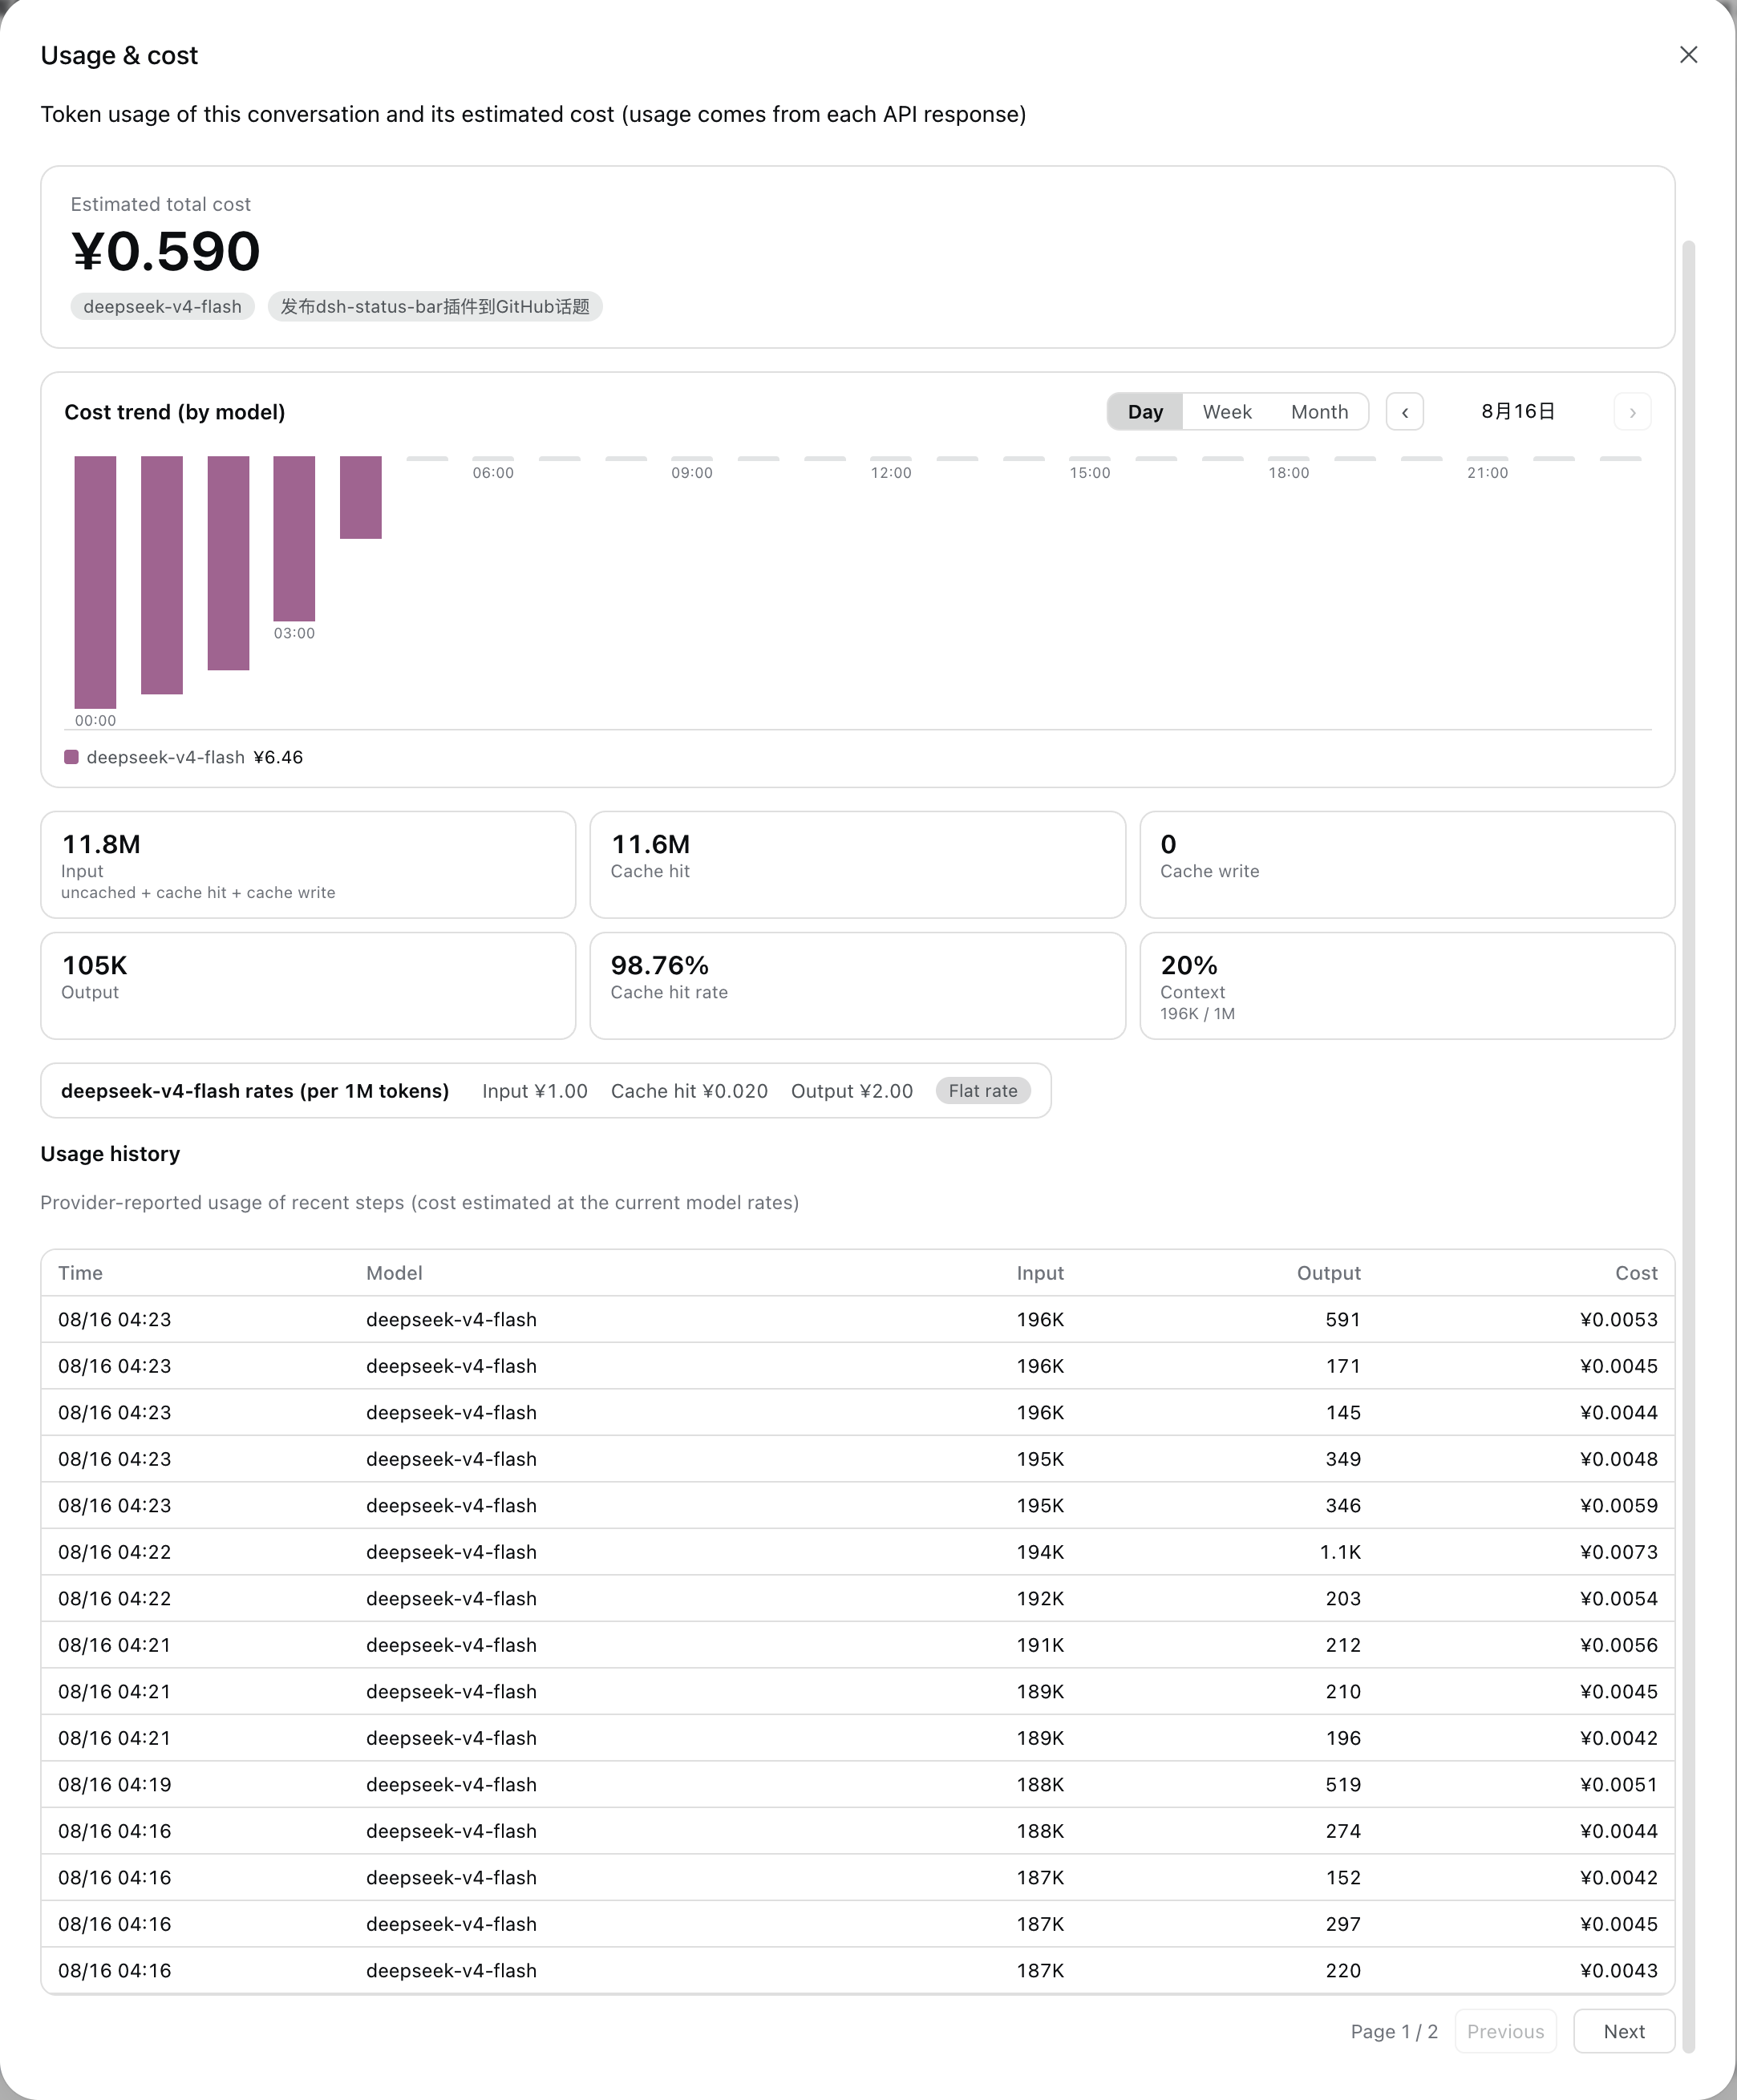
assistant/chunkevent, so the speed updates chunk by chunk while streaming; no polling, no external live-stats plugin - Cost estimation with a user-maintained model price book — per-model rates, per-model peak/off-peak schedules, each message/step priced with the model that actually produced it (input, cache-hit, cache-write and output priced separately at that step's own time), and a «Usage & cost» dialog with a stacked cost-trend chart (day / week / month), a paged per-step usage history (with a dedicated cache-hit column), and a total-cost hero
- Zero-config default — 13 segments ship enabled; everything else is a checkbox away
- Useful options — multi-line wrapping (so nothing gets truncated), live TPS, per-model cost estimation with peak/off-peak pricing, currency choice (CNY / USD), a quick-toggle gear menu, and a dedicated settings page with one-click reset
- Clean takeover — the plugin's bar shadows the built-in
statscell at lower priority: while loaded it renders, when unloaded the built-in line returns untouched - Bilingual UI — client locale strings ship for English and Chinese, following the DSH locale system
Screenshots
The status bar replaces the built-in stats line with near-native live session telemetry (status · model · turns · context · cache · TPS · session time · jobs · queue · errors), managed from a dedicated settings page — including a per-model price book with peak/off-peak pricing:

| Toggle & reorder on the go (segment list) | Usage & cost dialog (trend chart · stat cards · history) |
|---|---|
 |
 |
Compatibility
| Item | Value |
|---|---|
| DSH versions | 0.1.1-rc.2 (mainline master) — earlier RCs may work but are not verified |
| Last verified | 2026-08-19 |
| Runtime | Node ≥ 22 (host) + modern browser (client); no external services |
| Peer relation | Fully independent of @linxin666/dsh-live-stats (dsh-web-ui family): this plugin serves its own plugin-private statusBarLiveTokenUsage projection key, while live-stats serves the separate liveTokenUsage key. Distinct keys — the projection registry keeps both units regardless of registration order or stateVersion, so enabling both plugins never displaces the bar's live TPS |
Install / Uninstall
Install
# From npm (recommended)
dsh plugin --profile web add @bananiceee/dsh-status-bar

# Or pin an exact npm version
dsh plugin --profile web add @bananiceee/dsh-status-bar@0.1.9

# From a local checkout (profile assembly; `web` is a hardcoded alias for `--profile web`)
dsh plugin --profile web add ../dsh-status-bar

# Or from the GitHub repository
dsh plugin --profile web add github:Starlight-bananice/dsh-status-bar

# Or a pinned release tarball — immutable and versioned (attached to every
# GitHub release; handy when git access to the repo is awkward)
dsh plugin --profile web add https://github.com/Starlight-bananice/dsh-status-bar/releases/download/v0.1.9/bananiceee-dsh-status-bar-0.1.9.tgz
Note: pnpm 11 enforces a 24h
minimumReleaseAgefor freshly published packages — if a same-day release is rejected, append--config.minimumReleaseAge=0to thedsh plugin addcommand.
Note: pnpm fetches GitHub-hosted packages from
codeload.github.comand does not read your git proxy config. If the install hangs or fails with a network error (e.g.error (23)), export an HTTP(S) proxy:export HTTPS_PROXY=http://127.0.0.1:7890 HTTP_PROXY=http://127.0.0.1:7890and re-run.
Since v0.1.5: the built
lib/artifacts are committed to the repository — a git install is ready to run immediately, no build step required. Add the plugin, restart DSH Web, done. (Installs of ≤ v0.1.4 shipped nolib/, so they needed the manual build described under Development.)
# Or runtime injection without a restart (developer workflow)
#   dev_inject_plugin / dsh-super-injector → point at this repository
Then start/restart DSH Web. No configuration is required — the bar appears with its defaults.
Upgrade
# npm installs: update straight to the latest registry version
dsh plugin --profile web update @bananiceee/dsh-status-bar

# or re-add a pinned version
dsh plugin --profile web add @bananiceee/dsh-status-bar@0.1.9

# github: installs — pnpm pins a ref-less `github:` dependency to the commit
# resolved at install time, so `dsh plugin update github:...` reports
# "Already up to date" and keeps the old build. Upgrade with a re-add:
dsh plugin --profile web remove @bananiceee/dsh-status-bar
dsh plugin --profile web add github:Starlight-bananice/dsh-status-bar#v0.1.9
Disable
- Hide the bar only — the client master switch (Settings → Plugins → Status Bar, or the gear menu) turns the bar off instantly; the host projections and usage ledger keep running.
- Stop the plugin entirely — remove it from the profile's
bundleslist (equivalent to uninstall below); re-adding restores it.
Uninstall
dsh plugin --profile web remove @bananiceee/dsh-status-bar
Removal restores the built-in stats line automatically (shadow cell released). Data left behind: browser localStorage (dsh.statusBar.v1) and the host usage file (see Permissions & data) are not deleted — remove them manually if you want a clean slate.
Quick start
Install (above), restart DSH Web.
Start a session — the bar shows status · model · turns · durations · speeds · cache hit · tokens · context · TPS · session time · jobs · queue · errors by default.
Open Settings → Plugins → Status Bar to toggle/reorder segments, enable wrapping, or reset.
Want cost estimates? Add the models you use to the model price book:
# In Settings → Plugins → Status Bar → Model price book:
# model "deepseek-chat" → input 2 / cache read 0.5 / cache write 2 / output 8 (CNY per 1M tokens)
# optional: enable peak/off-peak with DeepSeek's official windows 09:00–12:00, 14:00–18:00
The bar then shows e.g.
≈¥0.0123for the current session; the figure is the sum of each model's usage × that model's own price (so switching models mid-session prices each part with its own rate). Click the chart button next to the gear to open the usage & cost dialog (stat cards, rate card, a paged usage history — 20 rows per page, up to 10 pages — with input / cache-hit / output / cost columns, and a per-model cost-trend chart with ‹ › period navigation).
Configuration
All configuration is client-side, stored in browser localStorage under dsh.statusBar.v1, edited via the settings page or the in-composer gear menu.
| Option | Default | Meaning |
|---|---|---|
enabled |
true |
Master switch; false hides the bar entirely |
wrap |
true |
Allow the bar to wrap onto multiple lines within the input card's width instead of eliding (the bar never runs past the input box's edges in either mode) |
segments |
13 on / 4 off (see below) | Ordered list of enabled segments |
cost.currency |
CNY |
Currency for cost display (CNY / USD) |
cost.models |
{} |
User-maintained model price book (model id → prices + schedule) |
Default segment state: on — status, model, counts, durations, speeds, cache hit, tokens, context, TPS, session time, jobs, queue, errors; off — title, workspace, agent, cost.
Model price book entry (values added when a model is configured): input 2, cache read 0.5, cache write 2, output 8 (per 1M tokens, in the configured currency); peak/off-peak disabled by default; when enabled, defaults to DeepSeek's official windows 09:00–12:00, 14:00–18:00, timezone local.
Environment variables: DSH_HOME (host-side) — base directory for the plugin's local data (default ~/.dsh). No other env vars, no secrets, no tokens.
Segment reference (all 17, toggleable & reorderable):
| Segment | Shows | Source |
|---|---|---|
| Status | ● running / idle / error dot | snapshot running / partial / lastAgentError |
| Model | model of the latest response | sessionModel projection (host fold of assistant/message events) |
| Title | session title (truncated) | SessionSummary |
| Workspace | workspace dir name | SessionSummary |
| Agent preset | preset name | SessionSummary |
| Turns & steps | N turns · M steps | sessionStats projection (window-fold fallback) |
| Model & tool time | LLM · tool-call wall time | sessionStats |
| TTFT & decode | avg first token · tok/s | sessionStats |
| Cache hit | prompt cache-hit share (2 decimals, capped at 99.99%) | tokenUsage |
| Tokens | billed input/output totals | tokenUsage |
| Context | context-window occupancy % | contextPressure |
| Throughput TPS | live generation rate (default on) | statusBarLiveTokenUsage projection (plugin-private key) — folded from assistant/chunk in real time; block-aware estimation (~4 chars/token + block/role framing, re-priced at block-end, EWMA against burst flushes), exact once the provider reports usage; 0 while the session is not generating |
| Session time | wall clock, ticks while running | turnTimings |
| Cost estimate | ≈¥0.0123 (off by default) | sessionUsage projection — each model's usage × its own effective price (flat or peak/off-peak at now), summed across models |
| Jobs | running background jobs | jobsBySession |
| Queue | queued messages | snapshot queue |
| Errors | failed/retried/over-limit count (>0 only) | node fold |
Permissions & data
| Category | What the plugin touches |
|---|---|
| Files | Host writes the usage ledger to <DSH_HOME>/dsh-status-bar/usage.jsonl (~/.dsh/dsh-status-bar/usage.jsonl by default; one record per assistant message: timestamp, model, input/cacheRead/cacheWrite/output tokens). In-memory history is a rolling 120-day window. |
| Network | No outbound requests, ever. The only endpoint is the plugin's own local webserver route /status-bar/api/usage (same origin as DSH Web, 127.0.0.1), serving the chart buckets. |
| Credentials | None. The plugin never reads, stores, or transmits API keys, tokens, or cookies. |
| User data | Client: localStorage["dsh.statusBar.v1"] (bar config + price book — no conversation content). Host: the usage ledger described above (token counts only, no prompts, no messages, no file contents). |
Troubleshooting
| Symptom | Cause & fix |
|---|---|
| Bar does not appear | Master switch off → enable it in Settings → Plugins → Status Bar, or via the gear menu. localStorage cleared? Config resets to defaults. |
| TPS segment is 0 / blank | No stream has started yet, or the stream is between retries. The measurement window restarts on each llm/retry; the carried rate never goes blank after the first stream. |
| TPS conflicts with another plugin | None by design — this plugin serves its own statusBarLiveTokenUsage key; @linxin666/dsh-live-stats (if loaded) serves the separate liveTokenUsage key for its own UI. Distinct keys mean the registry keeps both units, so enabling both plugins never stops the bar's live speed. |
| Cost estimate missing | None of the session's models is in the price book (or they are all zero-priced) → add them in Settings → Plugins → Status Bar → Model price book. Costs are estimated at the book's rates (per model, flat or peak/off-peak), not provider billing. |
| Usage chart is empty | No assistant messages with provider-reported usage in the period yet, or DSH_HOME points elsewhere than expected (check usage.jsonl location above). |
| UI looks broken after an upgrade | Hard-refresh the browser (stale client bundle) and verify the plugin version in Settings. |
| Can't tell which version is installed | From the profile directory (macOS/Linux): node -p "require(process.env.HOME + '/.dsh/profiles/web/node_modules/@bananiceee/dsh-status-bar/package.json').version". Behind v0.1.5? Re-apply the Upgrade steps. |
Logs: the plugin writes no log files of its own — host-side diagnostics appear in the DSH web process output (profile logs); client-side issues surface in the browser devtools console.
Rollback: the settings page has a one-click Reset (restores all defaults). For the plugin itself, uninstall → re-add the previous version with dsh plugin --profile web add <pkg>@<version>; the built-in stats line is always restored automatically on removal.
Development
pnpm install            # devDependencies only (typescript / tsdown / @types); npm peers are provided by the DSH runtime closure and intentionally not declared
npm run build:client    # tsdown → lib/client.js (ModuleLoader bundle)
npm run build           # junction links + host tsc + client typecheck (needs DSH_CHECKOUT pointing at a dsh source checkout)
Build artifacts under lib/ are committed (since v0.1.5), so plain git installs work without any build step; the commands above exist to refresh the artifacts before a release. npm run build / typecheck:client need DSH_CHECKOUT (or the common-path probe) — client typechecking resolves against the checkout's lib/types through junction links. Host-side sources are plain TypeScript (Cordis plugin), client sources are React + the DSH client UI slots.
Keeping lib/ in sync: run pnpm install --frozen-lockfile (reproducible rebuilds use the exact toolchain pinned in pnpm-lock.yaml), then npm run verify before pushing (scripts/verify.sh rebuilds host + client and fails when the committed lib/ drifted from src/). The repository also ships a pre-push hook that runs it automatically whenever a push touches src/ or the build config — enable it once with:
git config core.hooksPath .githooks
The lib-sync GitHub Actions workflow enforces the same invariant in CI: a fast artifact-integrity check on every push/PR, plus a full rebuild-vs-lib/ drift check on PRs that touch src/ and on manual dispatch.
Contributing: fork the repository, branch off main, and open a PR — small, focused changes with a clear description are preferred. Report bugs via Issues with the DSH version, browser, and a minimal repro.
License & security
- License: MIT (© 2026 Starlight-bananice).
- Security: this plugin holds no credentials and makes no network calls; the attack surface is the DSH host process itself. To report a security issue privately, use GitHub's Security Advisories on this repository (https://github.com/Starlight-bananice/dsh-status-bar/security/advisories/new) — do not open a public issue for vulnerabilities.
相关推荐Related
-
 ruvnet/ruflo
🌊 The original agent meta-harness. Deploy intelligent multi-player swarms, coordinate autonomous workflows, and build c…
ruvnet/ruflo
🌊 The original agent meta-harness. Deploy intelligent multi-player swarms, coordinate autonomous workflows, and build c…
-
 amruthpillai/reactive-resume
A one-of-a-kind resume builder that keeps your privacy in mind. Completely secure, customizable, portable, open-source a…
amruthpillai/reactive-resume
A one-of-a-kind resume builder that keeps your privacy in mind. Completely secure, customizable, portable, open-source a…
-
 volcengine/OpenViking
Self-evolving Context Database for AI Agents. Unify Agent Memory, Knowledge RAG and Skills.
volcengine/OpenViking
Self-evolving Context Database for AI Agents. Unify Agent Memory, Knowledge RAG and Skills.
-
 Molunerfinn/PicGo
:rocket: The Ultimate Image Uploader for Efficient Creators. Supports Obsidian, Typora, VS Code etc. and 60+ image hosti…
Molunerfinn/PicGo
:rocket: The Ultimate Image Uploader for Efficient Creators. Supports Obsidian, Typora, VS Code etc. and 60+ image hosti…
-
 titanwings/colleague-skill
将冰冷的离别化为温暖的 Skill,欢迎加入数字生命1.0!Transforming cold farewells into warm skills? It's giving rebirth era. Welcome to Digital …
titanwings/colleague-skill
将冰冷的离别化为温暖的 Skill,欢迎加入数字生命1.0!Transforming cold farewells into warm skills? It's giving rebirth era. Welcome to Digital …
-
 nocobase/nocobase
NocoBase is an open-source AI + no-code platform for building business systems fast. Instead of generating everything fr…
nocobase/nocobase
NocoBase is an open-source AI + no-code platform for building business systems fast. Instead of generating everything fr…
-
 Tencent/WeKnora
Open-source LLM knowledge platform: turn raw documents into a queryable RAG, an autonomous reasoning agent, and a self-m…
Tencent/WeKnora
Open-source LLM knowledge platform: turn raw documents into a queryable RAG, an autonomous reasoning agent, and a self-m…
- Nagi-ovo/voyager Enhancement suite for Gemini, AI Studio, Claude & ChatGPT — plus a prompt manager for any web UI, DeepSeek Harness inclu…