
stopchewing/dsh-mcp-view
用于DeepSeek Harness Web GUI的MCP工具面板:会话中的所有MCP服务器和工具,按服务器分组,包含JSON模式、实时搜索以及来自真实会话日志的最后使用时间。
项目介绍Project Overview
dsh-mcp-view 是 DSH Web 界面的浮动 MCP 清单面板,可集中查看已配置的 MCP 服务器、连接状态、工具名称、描述与 inputSchema,并从真实会话日志统计最近使用时间和调用量,支持搜索、收藏、按会话筛选、健康检查及 JSON/Markdown 导出。需要在侧边栏快速核对 MCP 工具全景或排查工具可见性时使用。注意:面板显示的是全局注册表,会话内被代理作用域隐藏的工具可能不会按当前会话呈现。
dsh-mcp-view is a DSH Web GUI plugin that adds a floating MCP inventory panel. It lists configured MCP servers, transport, endpoints, connection state, registered tools, and their exact input schemas, and derives last-used times and usage stats from real session logs. It also provides search, favorites, per-session filtering, health checks, and export. Use it when inspecting available MCP tools or debugging visibility. Caveat: it shows the global registry, so agent-scoped session tools may be hidden from the current-session view.
请帮我了解并安装插件:【dsh-mcp-view】【https://github.com/stopchewing/dsh-mcp-view】把上面这条消息直接发给当前会话里的 DSH,让它帮你了解并安装。安装命令不一定准确,发给 DSH 更稳。Send this message to DSH in your current session. CLI install commands may not be accurate across systems — DSH will figure it out for you.
或使用命令行安装(适合开发者)Or use CLI install (for developers)
命令行安装CLI Install
dsh plugin --profile web add dsh-mcp-view把 stopchewing/dsh-mcp-view 加入你的 DSH 配置(web profile)即可启用。
READMEREADME

🔌 dsh-mcp-view
See every MCP server & tool in your DeepSeek Harness session — right in the Web GUI.






A floating MCP inventory panel for the DSH sidebar: servers grouped, tools with JSON schemas, live search, and last-used times pulled from real session logs — nothing invented.
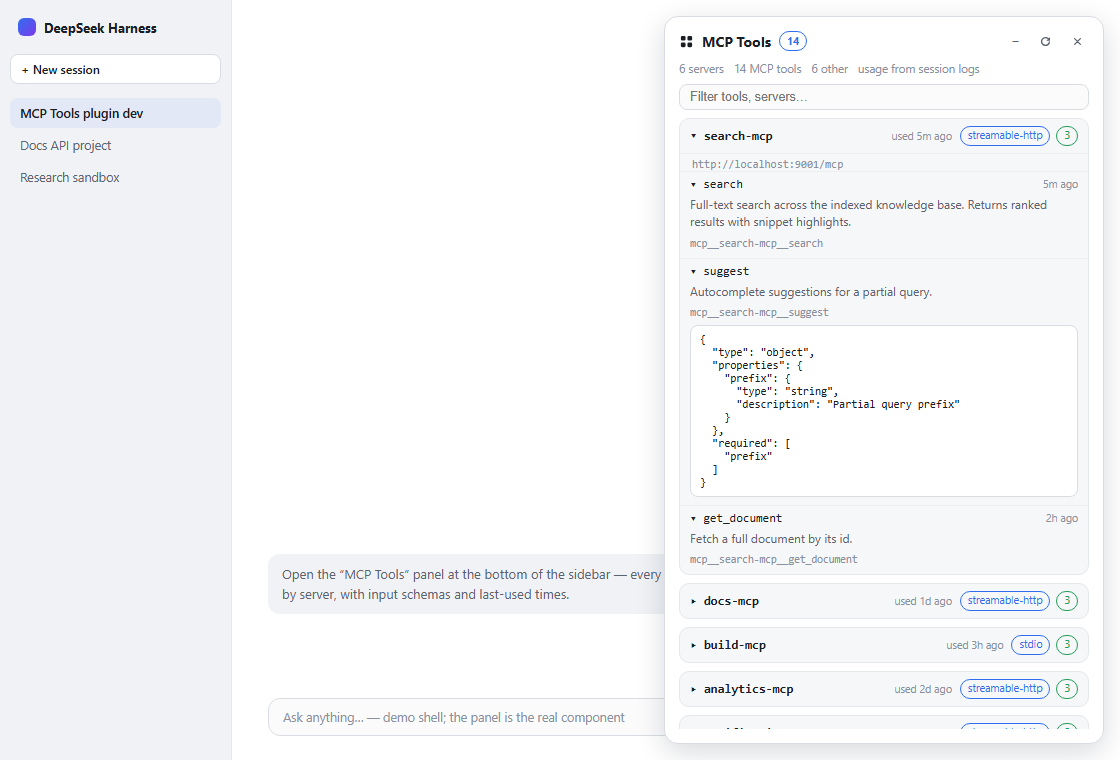
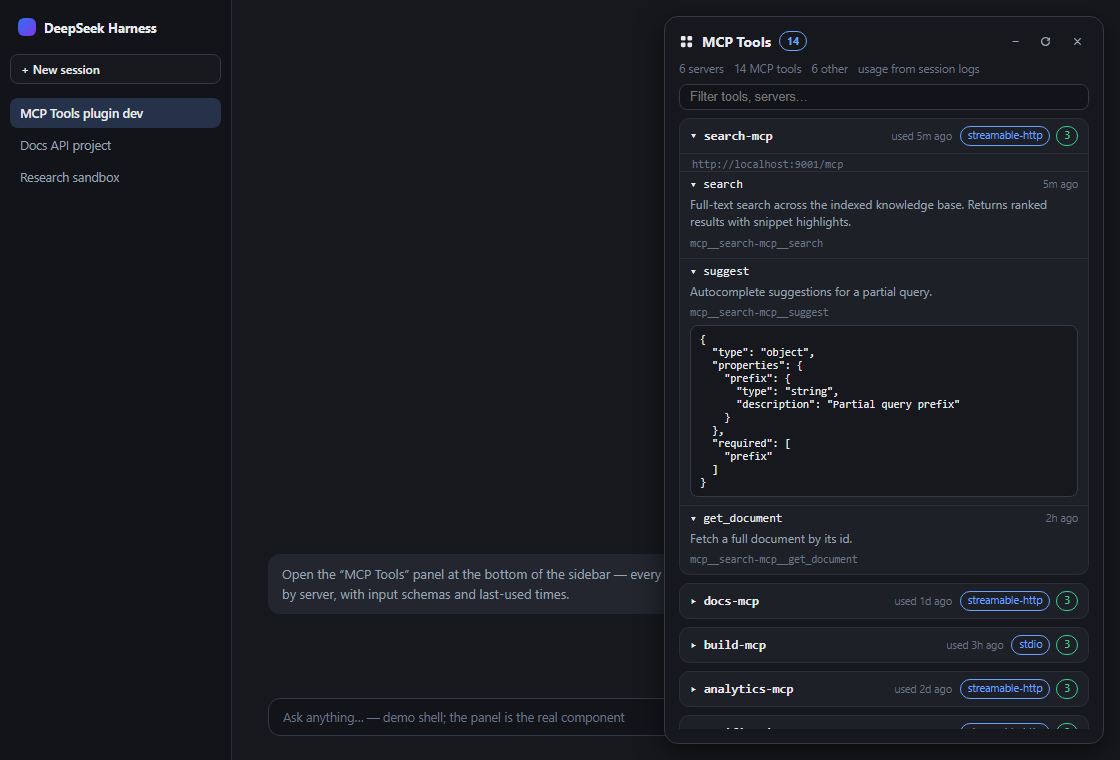
DSH runs your MCP servers (docs, build & analytics — whatever you have configured) and registers their tools into the shared mcp__* namespace — but there was no UI to see them. This plugin adds a one-click panel that answers: what MCP servers are configured, which tools are registered, what their input schemas look like, and when each was last used.
✨ Features
| 🖥 All servers, one panel | Every dsh-mcp-client instance in your profile, with transport (stdio / streamable-http) and endpoint (command or URL), plus connection state (active / disabled / no tools). |
| 🗂 Collapsed by default | Servers are folded into a single compact row; one click expands the tool list. + / − in the header expands or collapses everything. |
| 🧬 Full JSON schemas | Each tool shows its raw name, description and the exact inputSchema the model sees — expandable, prettified. |
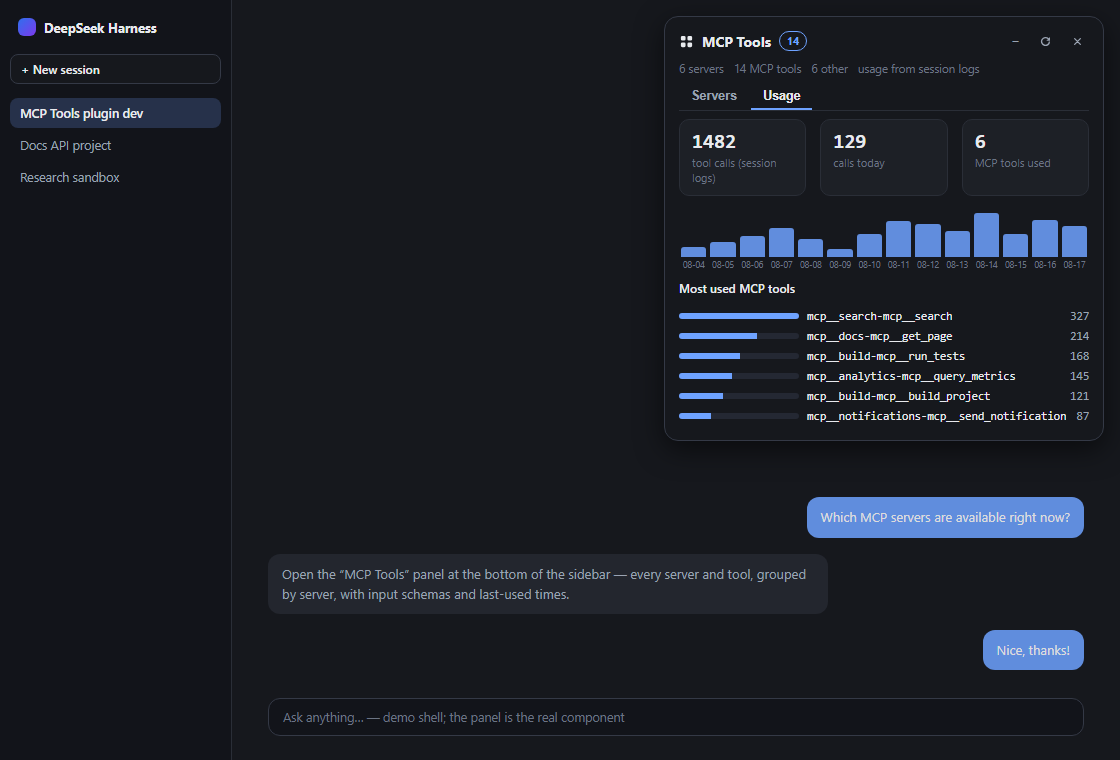
| 🕘 Last-used times & usage | Derived from real tool/call events in ~/.dsh/sessions/**/session.jsonl[.zstd] — per tool and per server, plus a Usage tab with total calls, a calls-per-day chart and the most-used tools. |
| 🔍 Live search | Filter by tool name, raw name, description, server or parameter names; auto-refresh every 10 s plus a manual refresh button. |
| 🎯 Per-session view | Toggle to see only the tools the current session's agent really sees (resolved from the session's agent scope). |
| ❤️ Favorites & sorting | Star servers/tools; sort by name / tools / last-used / favorites. State persists in localStorage. |
| ⚕️ Health checks | One-click probe of streamable-http endpoints (HEAD) → up/down badge per server. |
| 📤 Export | Download the whole inventory as JSON or Markdown. |
| 🧩 Non-MCP context | A collapsible list of the other (built-in / plugin) globally-registered tools, so you can see the whole tool landscape at a glance. |
⚙️ Configuration
The plugin accepts an optional config object on its row in cordis.patch.yml:
- insert:
    - id: mcp-view
      name: 'dsh-mcp-view'
      config:
        enabled: true          # master switch (default true)
        announceToAgent: true  # announce the plugin in the model's prompt band (default true)
📸 Screenshots
| Light | Dark | |
|---|---|---|
| Servers | |
 |
| Usage | 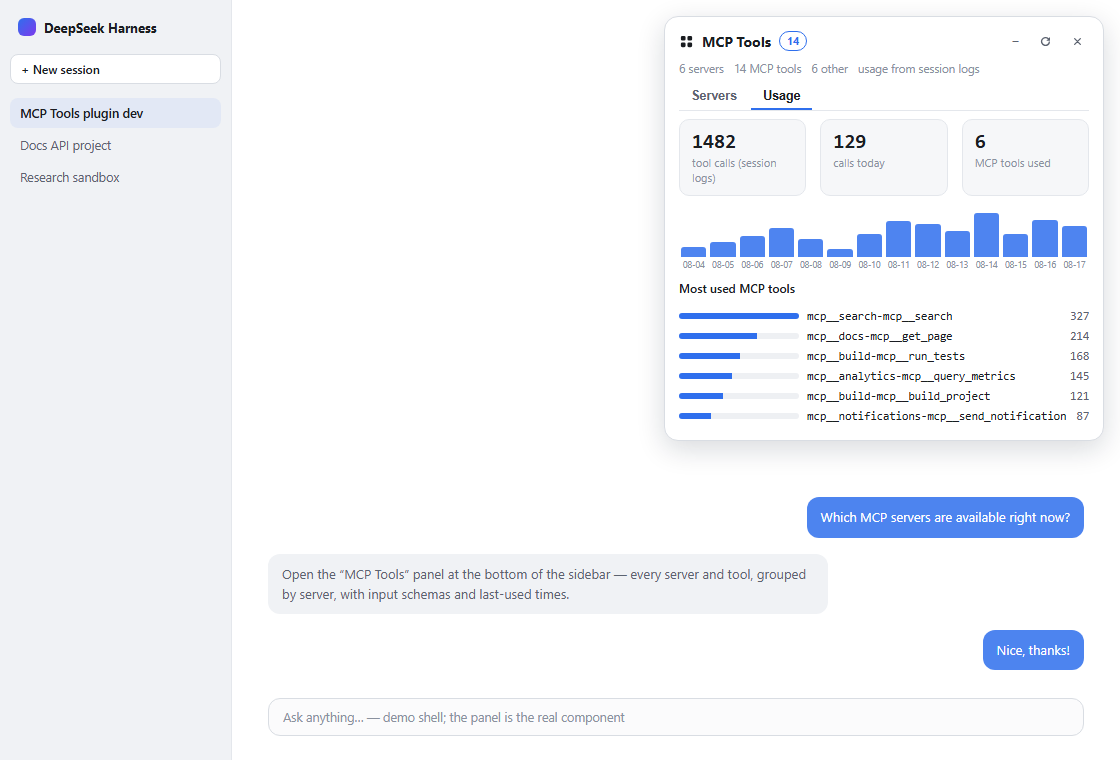 |
 |
⚡ Quick start
git clone https://github.com/stopchewing/dsh-mcp-view.git
cd dsh-mcp-view
dsh plugin --profile web add link:$(pwd)
Then restart dsh web and refresh the page — a 「MCP Tools」 button appears at the bottom of the sidebar.
📦 Install
From npm
dsh plugin --profile web add dsh-mcp-view
From the repository
git clone https://github.com/stopchewing/dsh-mcp-view.git
dsh plugin --profile web add link:/absolute/path/to/dsh-mcp-view
Manual (no CLI)
Put this package into the profile's
node_modules(copy, or a junction on Windows):New-Item -ItemType Junction -Path "$env:USERPROFILE\.dsh\profiles\web\node_modules\dsh-mcp-view" -Target "<abs-path>\dsh-mcp-view"Append to
~/.dsh/profiles/web/cordis.patch.yml:- insert: - id: mcp-view name: 'dsh-mcp-view'Restart
dsh web, then F5 the page.
The profile patch is watched, so the host half activates live; the client bundle is served fresh at
/plugins/dsh-mcp-view/client.js— a page refresh is all the browser needs.
🎛 Usage
- Click 「MCP Tools」 in the sidebar footer (icon-only when the sidebar is collapsed).
- Browse servers — each row shows transport, tool count and last use; click to expand tools.
- Click a tool to see its description, full public name and JSON input schema.
- Type in the filter box to narrow tools and servers;
Escor ✕ closes the panel.
🗺 Architecture
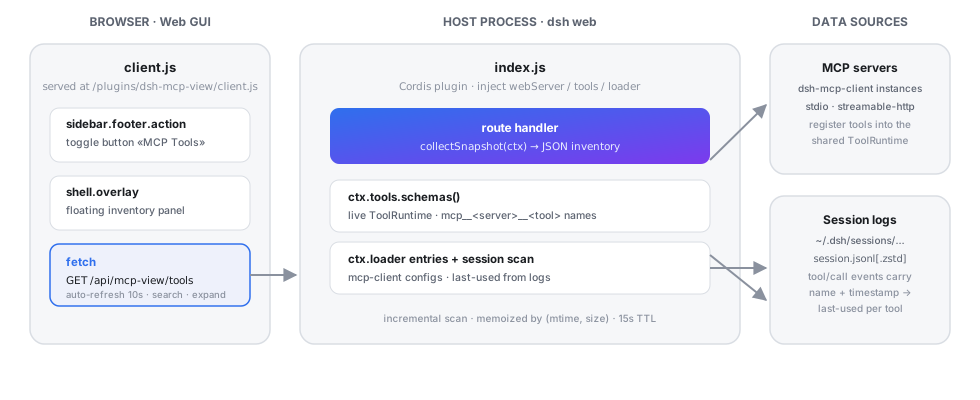
| Half | File | Role |
|---|---|---|
| Host | lib/index.js |
GET /api/mcp-view/tools returns the JSON inventory: MCP instances from the Cordis loader, live tool schemas from ctx.tools, and last-use history scanned from session logs (incremental scan memoized by file mtime/size, 15 s TTL). |
| Browser | lib/client.js |
Client plugin bundle: registers the sidebar toggle in the sidebar.footer.action slot and the floating panel in the shell.overlay slot. |
No changes to dsh sources — it is a hot-pluggable profile plugin, same mechanism as the @linxin666 web-ui family.
🔒 Security & privacy
- Local-only. Everything runs in your dsh host process and browser; the only network traffic is to the MCP servers you already configured.
- No telemetry, no analytics, no external calls — the panel never leaves your machine.
- The
/api/mcp-view/toolsroute is served by the same-origin webserver; it is read-only — it cannot call MCP tools, only list them. - Last-used times come from your own session logs on disk; nothing is sent anywhere.
- Passwords / credentials of your MCP servers are never exposed — only transport type and endpoint URL.
🧩 Compatibility
@deepseek-ai/dsh0.1.0-rc.6(web profile) — same cadence as the ecosystem's pinned SDK versions.- Node
^22.19.0 || >=24.0.0(the dsh runtime requirement — zstd session decoding is used). - Browser: Chrome / Edge / Firefox (React 18, no build step for the client bundle).
❓ FAQ
Are MCP servers per-session or shared?
Shared. MCP servers are configured once at the profile level (cordis.patch.yml), connect once per process, and register their tools into the process-wide ToolRuntime — every session and workspace sees the same set. A session whose agent preset restricts tools may hide them from the model, but the registry stays global.
Where does «used …» come from?
From tool/call events in your persisted session logs (~/.dsh/sessions). It is the real dispatch timestamp of the last call of that tool. If the log has no calls for a tool, the hint is simply absent.
Why are only some tools listed under "Other tools"?
The panel shows the global registry. Per-session agent tools (e.g. pwsh, read) register in the session's scope layer, so they are not part of the global view.
Does the panel slow things down? No. The session scan is incremental (only changed files are re-read) and rate-limited to once per 15 s; the browser auto-refresh is 10 s.
🛠 Development
dsh-mcp-view/
├─ src/
│  └─ index.ts      # host plugin (TypeScript): route + inventory + session scan
├─ lib/
│  ├─ index.js      # compiled host output (npm run build)
│  └─ client.js     # browser bundle (window.__ModuleLoader__)
├─ test/            # node --test unit tests
├─ cordis.patch.yml # profile roster insert
├─ docs/            # preview data, template, screenshots, architecture
└─ package.json     # dsh.bundle.patch + dsh.client manifest
The host plugin is written in TypeScript (src/index.ts); compile it with
npm run build (emits lib/index.js + types). The browser bundle
(lib/client.js) uses the DSH module-loader format and is maintained as a
checked JS bundle. Run npm test (Node's built-in test runner) and
npm run typecheck locally.
Rebuild the README preview screenshots (requires Chrome):
# 1. merge live inventory + session scan into docs/preview.html
#    (docs/preview-data.json + docs/preview.template.html → docs/preview.html)
# 2. screenshot with headless Chrome:
chrome --headless=new --screenshot=docs/screenshots/panel-light.png --window-size=1120,760 "file:///abs/path/docs/preview.html?theme=light"
#    repeat with ?theme=dark
🤝 Contributing
Found a bug, want a new view (per-session visibility, tool stats, dark-mode polish)? Open an issue or send a PR — they're welcome.
Star ⭐ this repo if the panel made your MCP tooling visible — it helps other DSH users find it (and it keeps the maintainers motivated). After your first release, submit it to awesome-dsh-plugin and awesome-deepseek-harness to reach the whole ecosystem.
📜 License
MIT © 2026 stopchewing
相关推荐Related
-
 nexu-io/open-design
🎨 Best DeepSeek Harness Design Plugin. The open-source Claude Design alternative. 🖥️ Local-first desktop app. 🖼️ Your…
nexu-io/open-design
🎨 Best DeepSeek Harness Design Plugin. The open-source Claude Design alternative. 🖥️ Local-first desktop app. 🖼️ Your…
-
 ruvnet/ruflo
🌊 The original agent meta-harness. Deploy intelligent multi-player swarms, coordinate autonomous workflows, and build c…
ruvnet/ruflo
🌊 The original agent meta-harness. Deploy intelligent multi-player swarms, coordinate autonomous workflows, and build c…
-
 amruthpillai/reactive-resume
A one-of-a-kind resume builder that keeps your privacy in mind. Completely secure, customizable, portable, open-source a…
amruthpillai/reactive-resume
A one-of-a-kind resume builder that keeps your privacy in mind. Completely secure, customizable, portable, open-source a…
-
 esengine/DeepSeek-Reasonix
DeepSeek-native AI coding agent for your terminal. Engineered around prefix-cache stability — leave it running.
esengine/DeepSeek-Reasonix
DeepSeek-native AI coding agent for your terminal. Engineered around prefix-cache stability — leave it running.
-
 volcengine/OpenViking
Self-evolving Context Database for AI Agents. Unify Agent Memory, Knowledge RAG and Skills.
volcengine/OpenViking
Self-evolving Context Database for AI Agents. Unify Agent Memory, Knowledge RAG and Skills.
-
 Molunerfinn/PicGo
:rocket: The Ultimate Image Uploader for Efficient Creators. Supports Obsidian, Typora, VS Code etc. and 60+ image hosti…
Molunerfinn/PicGo
:rocket: The Ultimate Image Uploader for Efficient Creators. Supports Obsidian, Typora, VS Code etc. and 60+ image hosti…
-
 titanwings/distilly
Distilly — Distill how they think into reusable Skills for any Agent or Bot. Formerly Colleague Skill(原同事 Skill).
titanwings/distilly
Distilly — Distill how they think into reusable Skills for any Agent or Bot. Formerly Colleague Skill(原同事 Skill).
-
 titanwings/colleague-skill