whoisDDD/dsh-quota-dashboard
DSH plugin for AI API balance/quota monitoring: DeepSeek peak/valley countdown, OpenCode Go quota, host-side key isolation, terminal-style panel, persistent config. / DSH Web 插件:AI API 余额/额度监控,DeepSeek 峰谷倒计时、OpenCode Go 额度、Key 主机侧隔离、终端风格面板、配置持久化。
项目介绍Project Overview
这是 DSH Web GUI 的 AI API 配额/余额实时监控插件,在侧边栏底部提供按钮与终端风格面板,聚合 DeepSeek 余额、OpenCode Go 订阅额度及自定义端点,支持状态点、定时刷新、DeepSeek 峰谷倒计时与主题适配。适合需要集中查看多家 API 余额和额度窗口时使用。默认仅内置 DeepSeek 官方与 OpenCode Go,其他平台需通过自定义端点接入。
This is a realtime AI API quota and balance monitor plugin for the DSH Web GUI. It adds a sidebar button and terminal-style panel that aggregate DeepSeek balance, OpenCode Go subscription quota windows, and custom API endpoints, with status dots, auto-refresh, theme support, and a DeepSeek peak/valley countdown. Use it when you need a centralized view of API spending and quota. Only DeepSeek official API and OpenCode Go are built in; other platforms require custom endpoints.
请帮我了解并安装插件:【dsh-quota-dashboard】【https://github.com/whoisDDD/dsh-quota-dashboard】把上面这条消息直接发给当前会话里的 DSH,让它帮你了解并安装。安装命令不一定准确,发给 DSH 更稳。Send this message to DSH in your current session. CLI install commands may not be accurate across systems — DSH will figure it out for you.
或使用命令行安装(适合开发者)Or use CLI install (for developers)
命令行安装CLI Install
dsh plugin --profile web add github:whoisDDD/dsh-quota-dashboard把 whoisDDD/dsh-quota-dashboard 加入你的 DSH 配置(web profile)即可启用。
READMEREADME
dsh-quota-dashboard
中文说明 | English
A universal AI API quota / balance live monitor plugin for the DeepSeek Harness (DSH) Web GUI.
A realtime button + terminal-style panel at the bottom of the sidebar aggregates your balances (DeepSeek official API…) and subscription quota windows (OpenCode Go…), with all other platforms attached via the custom endpoint. The DeepSeek title shows a live peak/valley countdown (per the latest official peak/valley pricing: peak = Beijing time Mon–Fri 9:00–12:00 & 14:00–18:00, 2× the off-peak price; all other hours, including all of the weekend, are valley at half price). The panel always follows the DSH light/dark theme. Auto-refresh every 30s–5min, or manual refresh.
Highlights
- 🎛️ Interactive settings UI – pick a platform → paste Base URL / API Key (optionally persist locally) → enable; remove anytime
- 🖥️ Per-provider cards – balance cards show amount + breakdown; quota cards show per-window used% bars (left→right fill, green <50% → orange 50–80% → red ≥80%) + reset time
- 🔴🟡🟢 Status dots – one dot per enabled provider on the sidebar button, colored by severity; overall shows the worst
- ⏱️ Realtime refresh – 30s / 1 / 2 / 5 min, plus manual refresh
- 🔑 Key physical isolation – panel input (persisted locally, 0600) → DSH credentials vault → environment variable; the key stays in the host process, never in URLs / logs / browser
- 🌗 Theme-aware – follows DSH light/dark automatically; no independent color options
- ⏳ DeepSeek peak/valley countdown – live peak/valley indicator + countdown in the title (1s precision; only the countdown digit re-renders, not the whole tree). Per the latest official peak/valley pricing: peak = Beijing time Mon–Fri 9:00–12:00 & 14:00–18:00 (2× price); all other hours, including the entire weekend, are off-peak valley (half price)
- 💾 Config persistence – enabled list + refresh interval dual-written to localStorage + host-side file (
~/.dsh/.dsh-quota-dashboard-client.json); survives DSH restarts, browser data clearing, and browser switches - 📦 Custom endpoint – any API returning balance/quota fields can be attached (auto recursive detection)
Supported platforms
| Type | Platform | Endpoint | Key env var |
|---|---|---|---|
| Balance | DeepSeek (official) | GET /user/balance |
DEEPSEEK_API_KEY |
| Quota windows | OpenCode Go (subscription) | GET /zen/go/v1/usage |
OPENCODE_GO_API_KEY |
| Custom | any compatible API (incl. Moonshot / OpenRouter / OpenAI / Anthropic / Together…) | full URL + key in panel | auto-detect |
Only the DeepSeek official API and the OpenCode Go subscription are built in by default; every other platform is attached through the custom endpoint (full API URL + key, with automatic recursive detection of balance/quota fields).
Install
dsh plugin --profile web add <path-to-dsh-quota-dashboard>
Pure JavaScript, zero build: index.js (host) + client.js (client) run as-is. Restart dsh web; a button appears at the bottom of the sidebar.
Usage
- Click the sidebar button to open the panel.
⚙️ Settings→ choose a platform → optionally change Base URL → enter API Key →Test→Enable.- If the DSH credentials vault or environment already has the key for a platform, the "Quick config" section shows a one-click enable button.
- Cards update live; pick an auto-refresh interval or turn it off.
Config (optional env var)
| Variable | Default | Meaning |
|---|---|---|
DSH_QUOTA_STATE_PATH |
$DSH_HOME/.dsh-quota-dashboard.json |
host-side persisted API keys (mode 0600) |
Key resolution order: panel input (persisted locally) → host state file → DSH credentials vault → environment variable.
Client config (enabled list + refresh interval) is automatically persisted to $DSH_HOME/.dsh-quota-dashboard-client.json (0600); no manual setup needed.
Develop / test
node --check index.js client.js
node scripts/test-parsers.mjs   # fixture parser unit tests
node scripts/test-peak.mjs      # peak/valley window + countdown boundary tests
node scripts/smoke-live.mjs     # live smoke (reads credentials, redacted output)
Changelog
See CHANGELOG.md.
License
MIT. Based on InvisibleSirius/dsh-quota-dashboard.
相关推荐Related
-
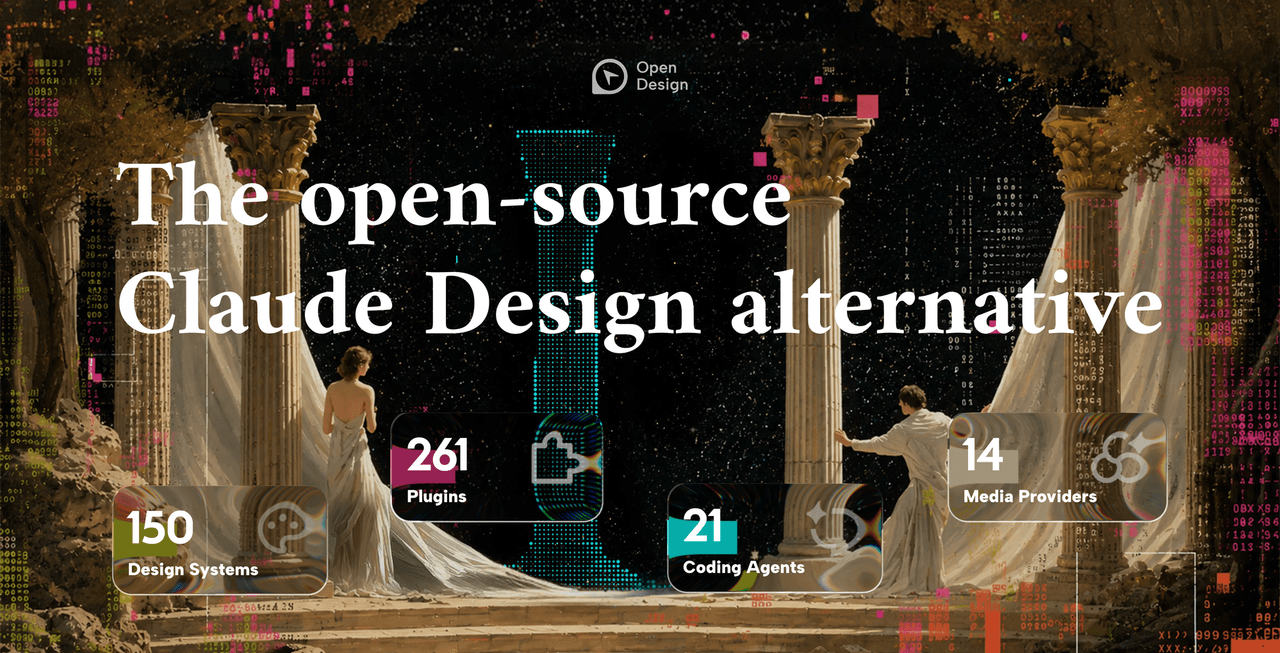 nexu-io/open-design
🎨 Best DeepSeek Harness Design Plugin. The open-source Claude Design alternative. 🖥️ Local-first desktop app. 🖼️ Your…
nexu-io/open-design
🎨 Best DeepSeek Harness Design Plugin. The open-source Claude Design alternative. 🖥️ Local-first desktop app. 🖼️ Your…
-
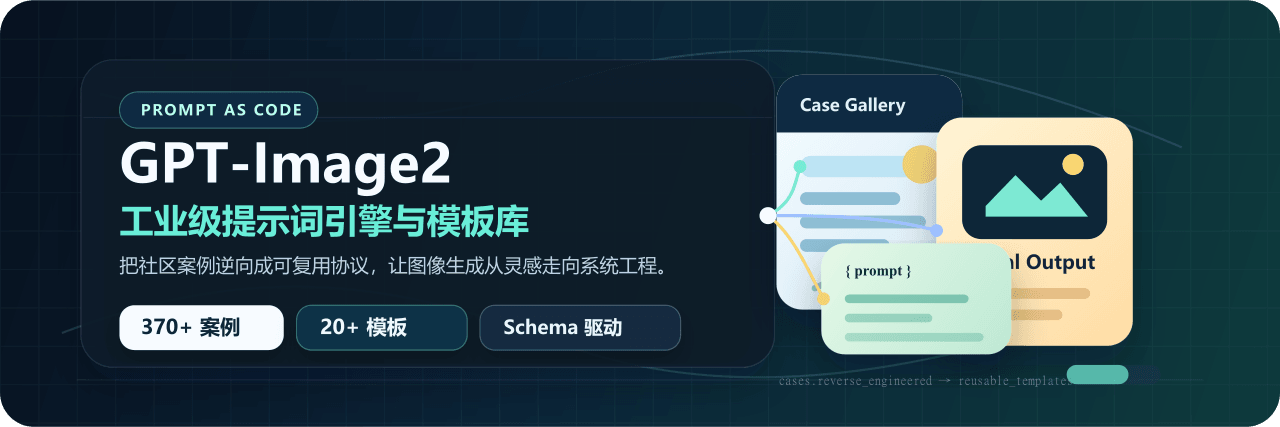 freestylefly/awesome-gpt-image-2
Prompt as Code | GPT-Image2 工业级提示词引擎与模板库,530+ 个案例逆向工程,20+ 套工业级模板,并提炼出Skills,持续更新中
freestylefly/awesome-gpt-image-2
Prompt as Code | GPT-Image2 工业级提示词引擎与模板库,530+ 个案例逆向工程,20+ 套工业级模板,并提炼出Skills,持续更新中
-
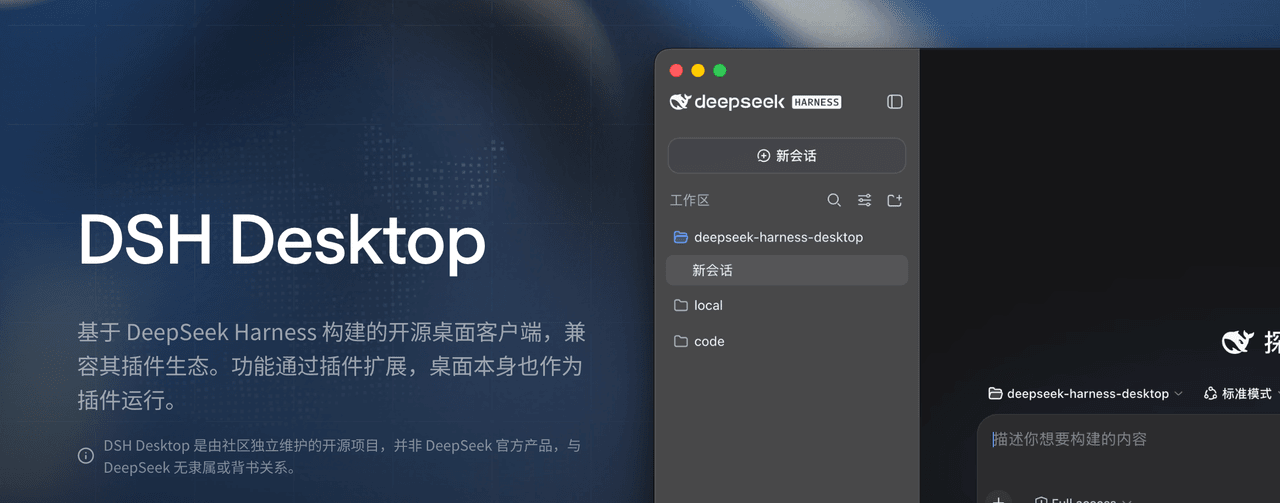 anywhere-labs/dsh-desktop
为 DeepSeek Harness (DSH) 插件生态打造的现代化桌面端解决方案。万物皆「插件」,桌面本身也是「插件」。
anywhere-labs/dsh-desktop
为 DeepSeek Harness (DSH) 插件生态打造的现代化桌面端解决方案。万物皆「插件」,桌面本身也是「插件」。
- Nagi-ovo/voyager Enhancement suite for Gemini, AI Studio, Claude & ChatGPT — plus a prompt manager for any web UI, DeepSeek Harness inclu…
-
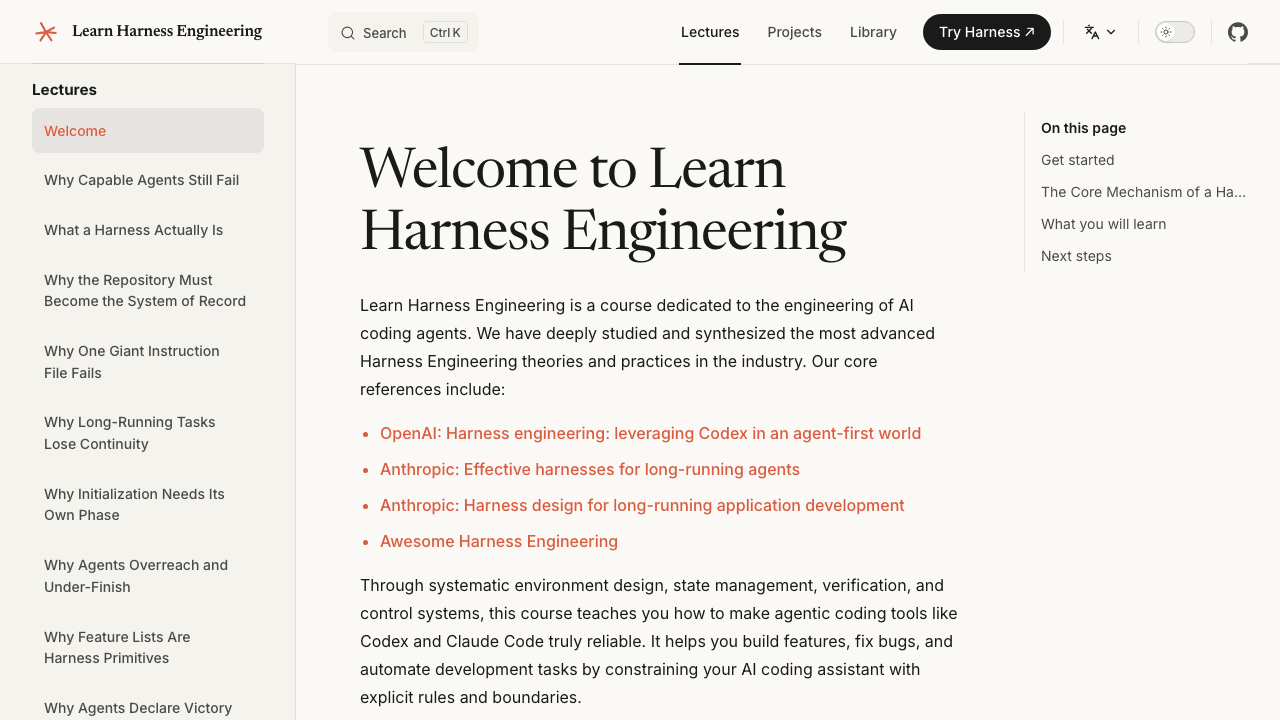 walkinglabs/learn-harness-engineering
Harness engineering beginner tutorial, from 0 to 1
walkinglabs/learn-harness-engineering
Harness engineering beginner tutorial, from 0 to 1
-
 awesome-dsh-plugin/awesome-dsh-plugin
A curated list of plugins for DeepSeek Harness (dsh) · DeepSeek Harness 插件精选列表
awesome-dsh-plugin/awesome-dsh-plugin
A curated list of plugins for DeepSeek Harness (dsh) · DeepSeek Harness 插件精选列表
-
 MemTensor/MemOS
Self-evolving memory OS for LLM & AI Agents: ultra-persistent memory, hybrid-retrieval, and cross-task skill reuse, with…
MemTensor/MemOS
Self-evolving memory OS for LLM & AI Agents: ultra-persistent memory, hybrid-retrieval, and cross-task skill reuse, with…
- yjh051108/dsh-routing-suite dsh-routing-suite — injector + router-standard kit: install the runtime injector first, then the task-aware reasoning-mo…