yokesky/dsh-usage-lens
DeepSeek Harness (DSH) 用量统计面板 — 使用统计仪表盘:GitHub风格热力图、每日令牌趋势、模型使用环形图。
项目介绍Project Overview
dsh-usage-lens 是 DeepSeek Harness Web UI 的用量统计面板皮肤,安装后在设置面板新增「用量统计」页面。核心能力包括总览卡片、280 天活跃热力图、每日 token 趋势图及双环饼图。适用于想直观回顾 token 消耗、会话数、活跃天数与模型使用分布的用户。注意:需先全局安装 dsh CLI 并重启 web 服务,源码 link 方式修改后需重新 build。
dsh-usage-lens is a skin plugin that adds a Usage Statistics page to the DeepSeek Harness Web UI settings. It provides overview cards, a 280-day activity heatmap, a daily token trend chart, and a model-usage donut chart. Use it to track token consumption, sessions, streaks, and model distribution. Note: requires a globally installed dsh CLI; rebuild and restart the web service after source modifications.
请帮我了解并安装插件:【dsh-usage-lens】【https://github.com/yokesky/dsh-usage-lens】把上面这条消息直接发给当前会话里的 DSH,让它帮你了解并安装。安装命令不一定准确,发给 DSH 更稳。Send this message to DSH in your current session. CLI install commands may not be accurate across systems — DSH will figure it out for you.
或使用命令行安装(适合开发者)Or use CLI install (for developers)
命令行安装CLI Install
dsh plugin --profile web add @yokesky/dsh-usage-lens把 yokesky/dsh-usage-lens 加入你的 DSH 配置(web profile)即可启用。
READMEREADME
dsh-usage-lens


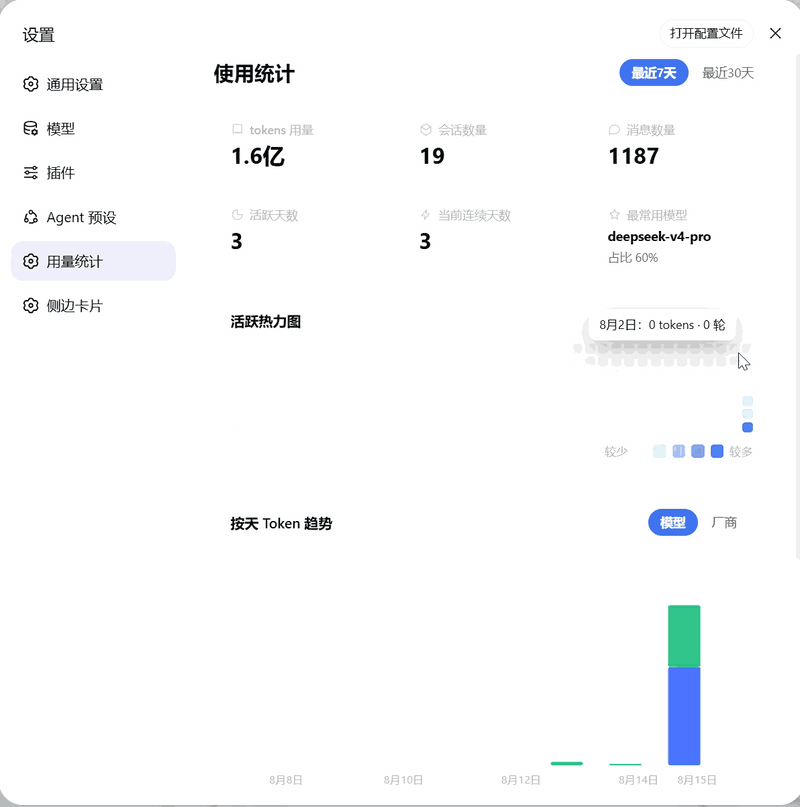
DeepSeek Harness(DSH)Web UI 的用量统计面板,风格参考作者喜欢的 ZCode Harness 设计。 安装后,设置面板会新增「用量统计」页面,直观展示你的使用情况。
预览
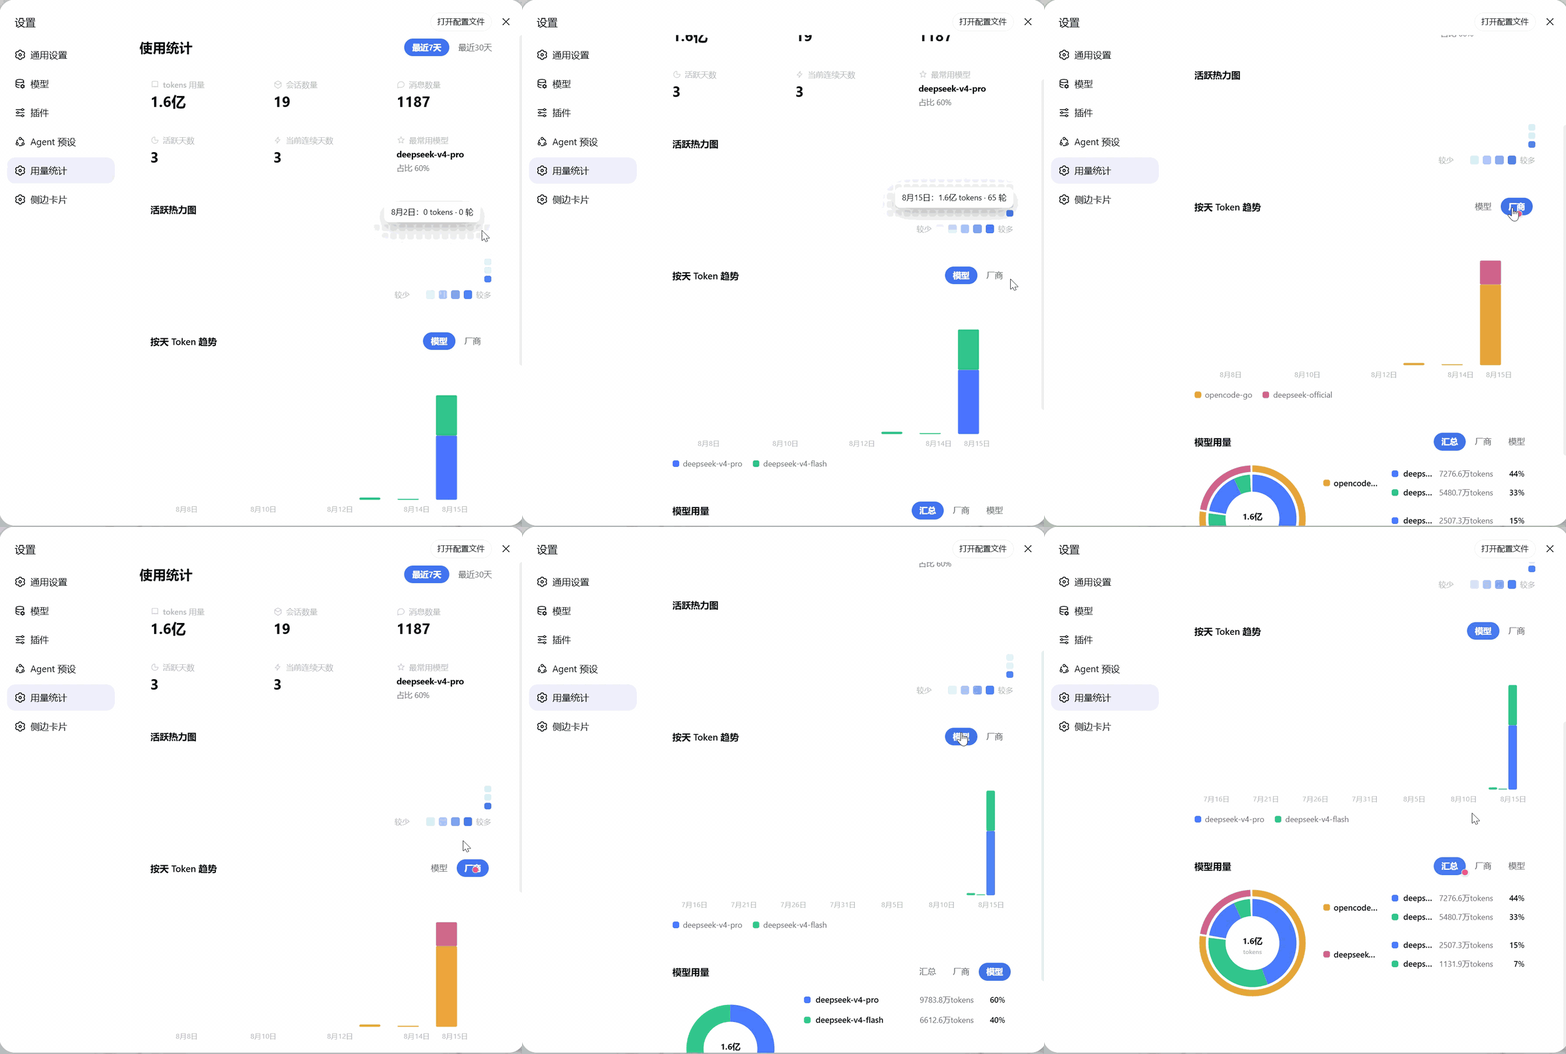
静态截图
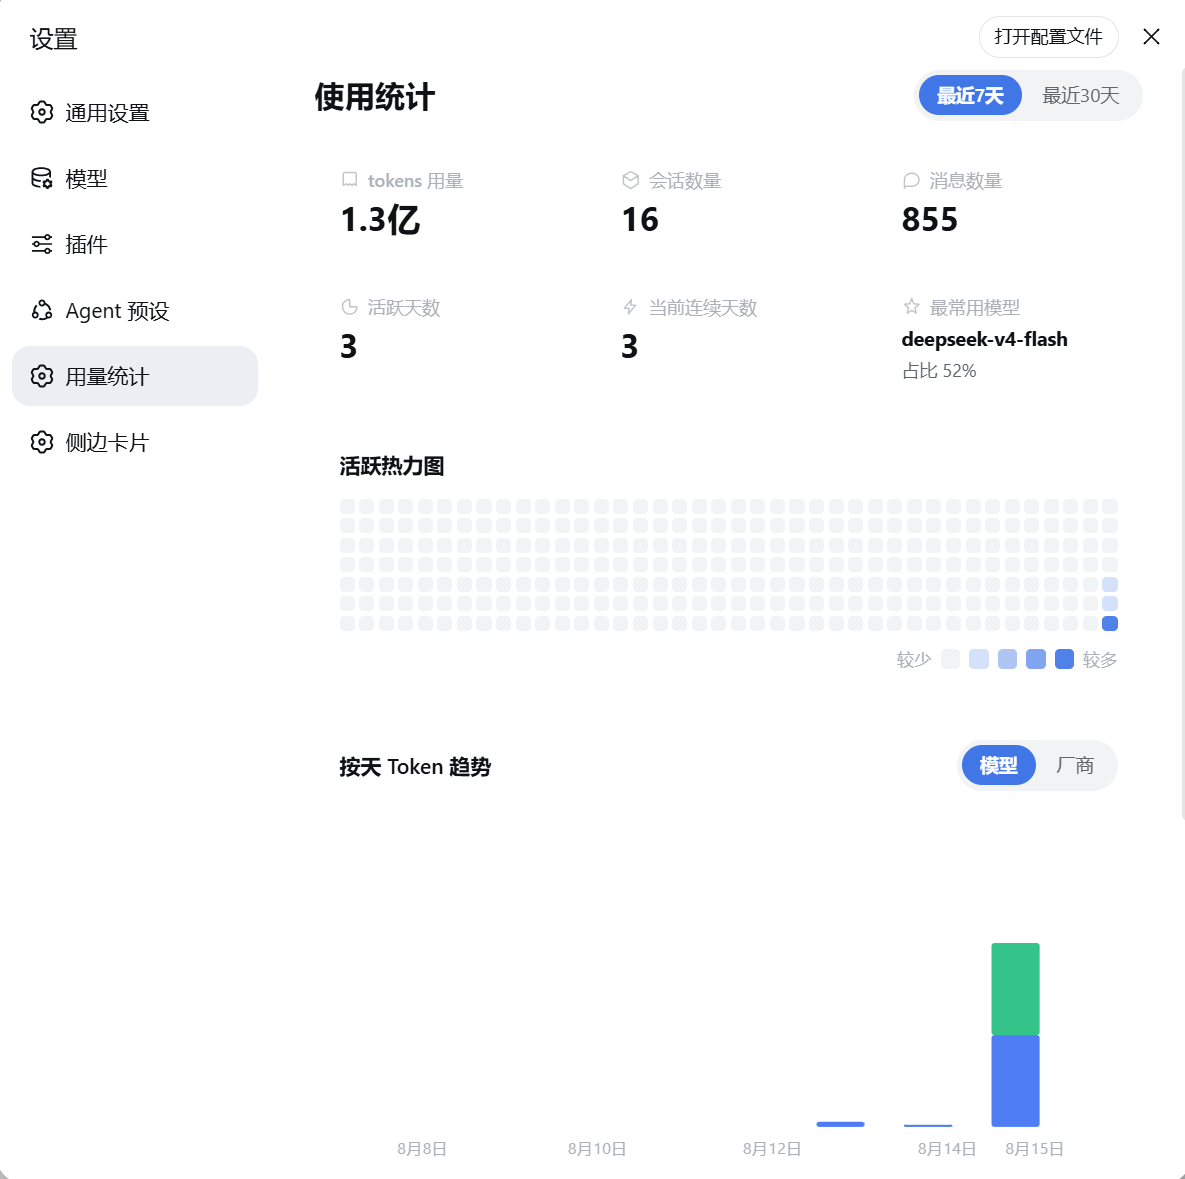
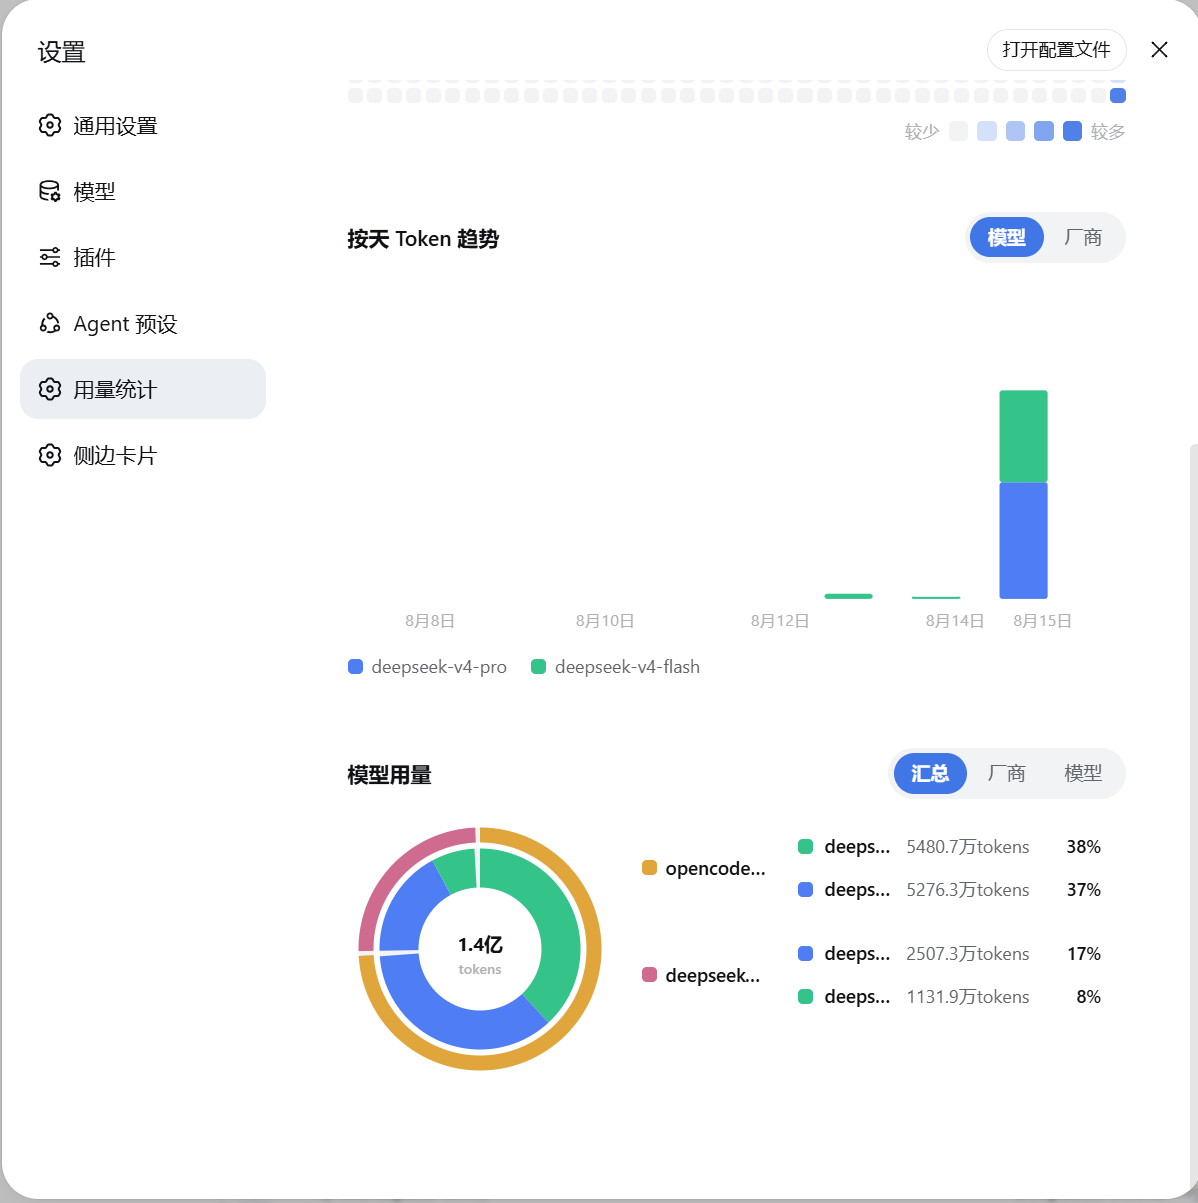
功能
- 总览卡片:tokens 用量、会话数量、消息数量、活跃天数、当前连续天数、最常用模型。
- 活跃热力图:GitHub 风格的 280 天活跃热力图,一眼看清使用节奏。
- 每日 Token 趋势:按天查看 token 消耗,可切换「模型 / 厂商」视角。
- 模型用量双环饼图:支持「汇总 / 厂商 / 模型」三种查看方式。
安装
方式一:npm 包
npm install -g @deepseek-ai/dsh   # 先安装 dsh CLI,然后才能执行 dsh 命令
dsh plugin --profile web add @yokesky/dsh-usage-lens
方式二:源码
# 需要已安装 dsh CLI(npm install -g @deepseek-ai/dsh),如已装可跳过
git clone https://github.com/yokesky/dsh-usage-lens.git
cd dsh-usage-lens
pnpm install
pnpm build
dsh plugin --profile web add link:<本仓库绝对路径>
说明:
link:方式指向本地源码,修改代码后重新pnpm build并重启 web 服务即可生效,无需重新安装。也可以直接从本仓库路径安装:dsh plugin --profile web add <本仓库路径>。
安装后
重启 web 服务,打开设置面板即可看到「用量统计」。
English
A usage statistics dashboard for the DeepSeek Harness (DSH) Web UI. Once installed, a new Usage Statistics page appears in Settings.
Features: overview cards (tokens, sessions, messages, active days, current streak, top model), a 280-day GitHub-style activity heatmap, a daily token trend chart with model/provider views, and a model-usage donut chart with summary/provider/model modes.
Install:
npm install -g @deepseek-ai/dsh
dsh plugin --profile web add @yokesky/dsh-usage-lens
Restart the web service, then open Settings → Usage Statistics.
数据说明 / Privacy
- 所有数据来自你本机的 DSH 会话记录,只在本地处理,不会上传到任何地方。
- 面板自动跟随 DSH 的亮色 / 暗色主题。
All data is read from your local DSH session logs and processed locally — nothing is uploaded. The panel follows DSH's light / dark theme automatically.
License
MIT © 2026 yokesky
相关推荐Related
-
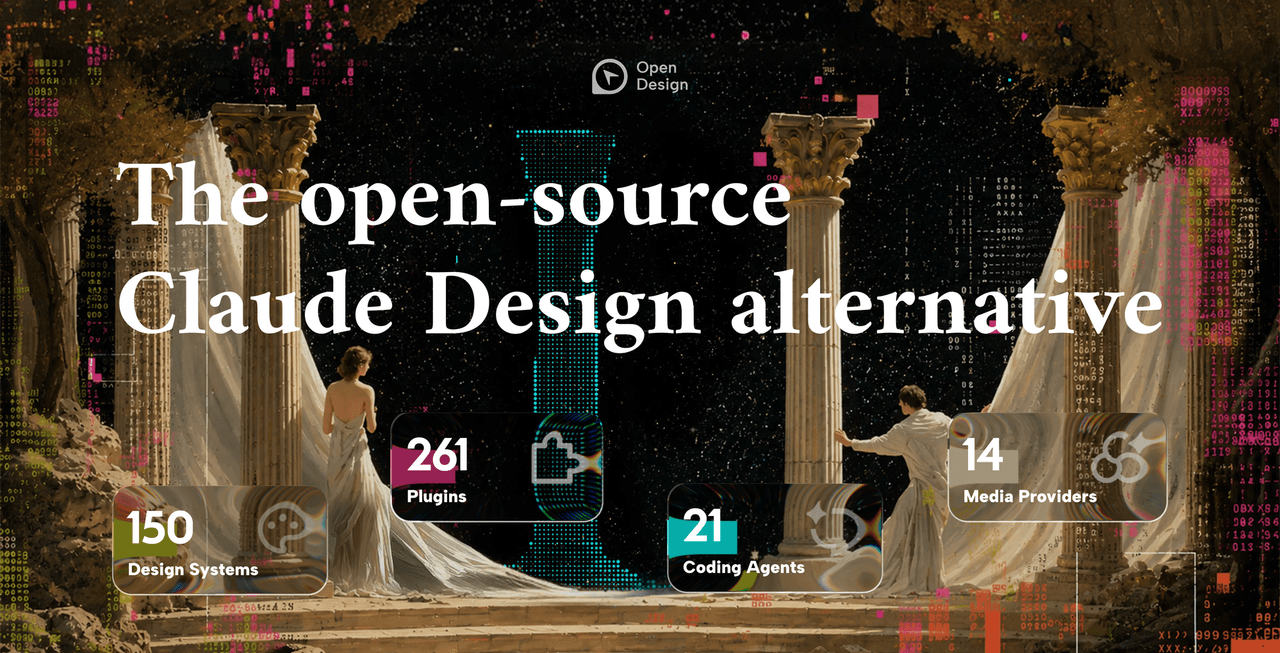 nexu-io/open-design
🎨 Best DeepSeek Harness Design Plugin. The open-source Claude Design alternative. 🖥️ Local-first desktop app. 🖼️ Your…
nexu-io/open-design
🎨 Best DeepSeek Harness Design Plugin. The open-source Claude Design alternative. 🖥️ Local-first desktop app. 🖼️ Your…
-
 ruvnet/ruflo
🌊 The original agent meta-harness. Deploy intelligent multi-player swarms, coordinate autonomous workflows, and build c…
ruvnet/ruflo
🌊 The original agent meta-harness. Deploy intelligent multi-player swarms, coordinate autonomous workflows, and build c…
-
 esengine/DeepSeek-Reasonix
DeepSeek-native AI coding agent for your terminal. Engineered around prefix-cache stability — leave it running.
esengine/DeepSeek-Reasonix
DeepSeek-native AI coding agent for your terminal. Engineered around prefix-cache stability — leave it running.
-
 Molunerfinn/PicGo
:rocket: The Ultimate Image Uploader for Efficient Creators. Supports Obsidian, Typora, VS Code etc. and 60+ image hosti…
Molunerfinn/PicGo
:rocket: The Ultimate Image Uploader for Efficient Creators. Supports Obsidian, Typora, VS Code etc. and 60+ image hosti…
-
 titanwings/colleague-skill
将冰冷的离别化为温暖的 Skill,欢迎加入数字生命1.0!Transforming cold farewells into warm skills? It's giving rebirth era. Welcome to Digital …
titanwings/colleague-skill
将冰冷的离别化为温暖的 Skill,欢迎加入数字生命1.0!Transforming cold farewells into warm skills? It's giving rebirth era. Welcome to Digital …
-
 Tencent/WeKnora
Open-source LLM knowledge platform: turn raw documents into a queryable RAG, an autonomous reasoning agent, and a self-m…
Tencent/WeKnora
Open-source LLM knowledge platform: turn raw documents into a queryable RAG, an autonomous reasoning agent, and a self-m…
- Nagi-ovo/voyager Enhancement suite for Gemini, AI Studio, Claude & ChatGPT — plus a prompt manager for any web UI, DeepSeek Harness inclu…
-
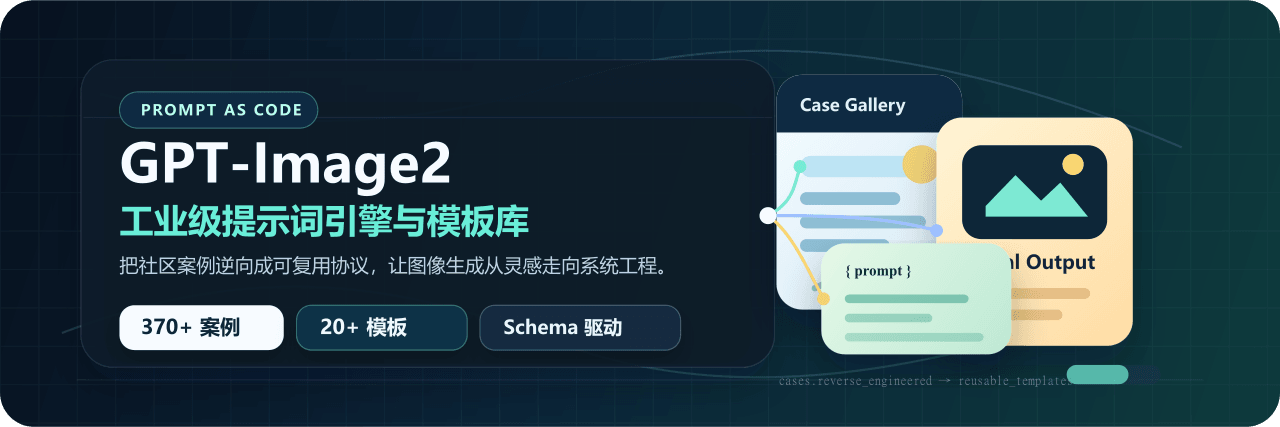 freestylefly/awesome-gpt-image-2
Prompt as Code | GPT-Image2 工业级提示词引擎与模板库,470+ 个案例逆向工程,20+ 套工业级模板,并提炼出Skills,持续更新中
freestylefly/awesome-gpt-image-2
Prompt as Code | GPT-Image2 工业级提示词引擎与模板库,470+ 个案例逆向工程,20+ 套工业级模板,并提炼出Skills,持续更新中