a554878526/dsh-debug-mode
Runtime-first Debug Mode plugin for DeepSeek Harness
Project Overview项目介绍
dsh-debug-mode is a plugin for DeepSeek Harness that enables AI-driven debugging. It inserts targeted probes and consolidates Browser, Electron, and Node events into structured JSONL, letting the agent prove the failing branch, apply a focused fix, verify it, and remove all temporary instrumentation. Use it for UI state issues, worker boundaries, async races, and serialization bugs that resist static inspection. Caveats: never log secrets, PII, or high-volume payloads—sample, hash, or truncate instead. Debug state is process-local, so refreshing or restarting ends the current session.
dsh-debug-mode 是面向 DeepSeek Harness 的运行时调试插件。它通过植入定向探针,将浏览器、Electron 与 Node 事件统一收集为结构化 JSONL,让智能体基于真实证据定位分支、修复并验证,再由 Fixed 操作清理探针与日志。适用于 UI 状态、异步竞争、序列化等静态分析无法证伪的问题。需注意:探针严禁记录密钥、PII 或大体量负载,应采样或哈希;其状态仅在进程内有效,刷新或重启即结束当前调试回合。
请帮我了解并安装插件:【dsh-debug-mode】【https://github.com/a554878526/dsh-debug-mode】Send this message to DSH in your current session. CLI install commands may not be accurate across systems — DSH will figure it out for you.把上面这条消息直接发给当前会话里的 DSH,让它帮你了解并安装。安装命令不一定准确,发给 DSH 更稳。
Or use CLI install (for developers)或使用命令行安装(适合开发者)
CLI Install命令行安装
dsh plugin --profile web add "github:a554878526/dsh-debug-mode#main"把 a554878526/dsh-debug-mode 加入你的 DSH 配置(web profile)即可启用。
READMEREADME
dsh-debug-mode
English | 中文
Runtime evidence for AI debugging in DeepSeek Harness.
Instead of asking an agent to guess from source code or asking you to copy browser and server logs into chat, Debug Mode installs surgical probes and captures their events as structured JSONL. The agent can then prove the failing branch, make a focused fix, verify it, and remove every temporary probe.
One command. One evidence loop. No log hunting.

Why use it?
| Ordinary debugging | Debug Mode |
|---|---|
| Browser console and server logs live in separate places | Browser, Electron, and Node evidence lands in one JSONL stream |
| Large unstructured logs bury the relevant branch | 1–3 probes record only hypothesis-relevant fields |
| The agent reasons from a pasted snapshot | The agent reads fresh runtime evidence after each reproduction |
| Temporary logging is easy to forget | The Fixed action triggers probe, process, and log cleanup |
Debug Mode is especially useful for UI state, worker boundaries, async races, serialization failures, and bugs that cannot be proven by static code inspection alone.
Install
Requires Node.js ^22.19.0 || >=24.0.0, pnpm on PATH, and DSH 0.1.0-rc.7 or later.
dsh plugin --profile web add "github:a554878526/dsh-debug-mode#main"
Restart dsh web, open a new task, then:
- Run
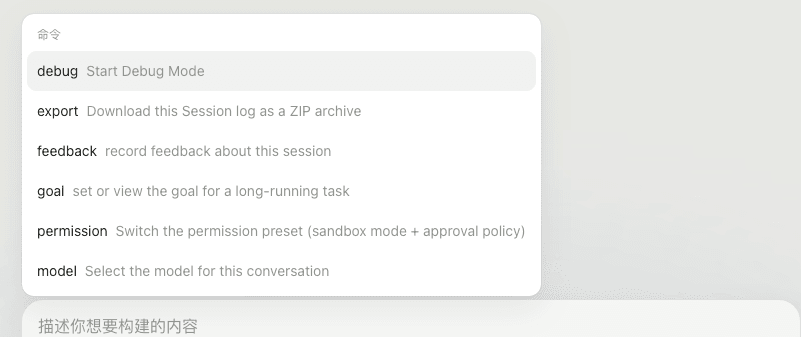
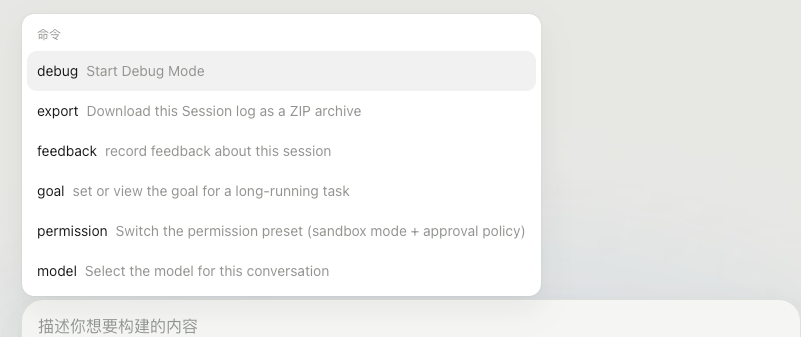
/debugand describe the bug. - Follow the reproduction instruction and click Continue.
- Review the verified fix, then click Fixed to clean up diagnostics.
Remove the plugin with:
dsh plugin --profile web remove dsh-debug-mode
Structured JSONL evidence
Each line is an independent event, so logs remain streamable, grep-friendly, and easy for an agent to summarize:
{"sessionId":"a1b2c3","runId":"pre-fix","hypothesisId":"H1","location":"SessionStore.ts:restore","message":"cache lookup","data":{"hit":true,"entryCount":3,"timestampNs":"1775543428486123456"},"timestamp":1775543428486}
Use stable fields:
sessionIdties events to one debug round.runIddistinguishespre-fix,post-fix, or repeated reproductions.hypothesisIdconnects an event to the assumption it proves or rejects.locationnames the runtime boundary, not just the file.datacontains the smallest safe payload needed for the decision.timestampis epoch milliseconds; large integer IDs belong in strings.
Never log secrets, credentials, PII, or full high-volume payloads. Count, sample, hash, or truncate instead.
Generate a session and probe
The bundled helper prints a session ID, log path, ingest command, and copy-ready Browser/Electron and Node probes:
python3 scripts/new_debug_session.py --root .
Start the printed ingest command before using a browser probe. A minimal event is:
__codexDebug({
  hypothesisId: "H1",
  location: "SessionStore.ts:restore",
  message: "cache lookup",
  data: { hit: cache.has(key), entryCount: cache.size },
});
The generated probe sends Browser/Electron events to the local ingest server with fetch; Node probes append JSONL directly. Its JSON.stringify replacer converts bigint values to decimal strings, avoiding serialization errors and precision loss.
After reproduction, summarize the evidence with:
python3 scripts/summarize_debug_log.py .codex-debug/debug-<session>.jsonl
In normal use the agent runs these helpers for you. They are documented here for custom instrumentation and CI workflows.
How the loop works
/debug activates a Host-enforced runtime phase and opens the composer dock. The agent must create a fresh session, start a working log transport, and add marked probes before asking for reproduction. Continue is disabled until that handoff succeeds.
After evidence arrives, the agent either applies the smallest supported fix or starts a new evidence round with a new log path. It cannot silently replace evidence collection with a console-only probe, broad static analysis, or an early fix. Fixed ends enforcement and asks the agent to remove all CODEX_DEBUG / __codexDebug instrumentation, ingest jobs, and .codex-debug/ logs.
Four helpers ship with the plugin:
new_debug_session.pycreates a session and ready-to-use probes.debug_ingest_server.pycollects Browser/Electron JSON events.summarize_debug_log.pycondenses JSONL evidence.find_instrumentation.pyverifies cleanup.
Develop
pnpm install
pnpm run check
dsh plugin --profile web add .
Restart the profile and open a new task after reinstalling so DSH loads the updated Host and client bundles.
Compatibility note
Versions 0.1.1 and earlier wrote a debug-mode/state event that official DSH builds cannot reopen. Stop dsh web, inspect affected logs, then apply the repair with automatic backups:
python3 scripts/repair_debug_mode_sessions.py
python3 scripts/repair_debug_mode_sessions.py --apply
Current Debug Mode state is process-local: restarting the Host, refreshing the page, or reopening a task ends the active loop. Run /debug again to start a new session.
Related相关推荐
-
 chuspeeism/dashi-taskboard
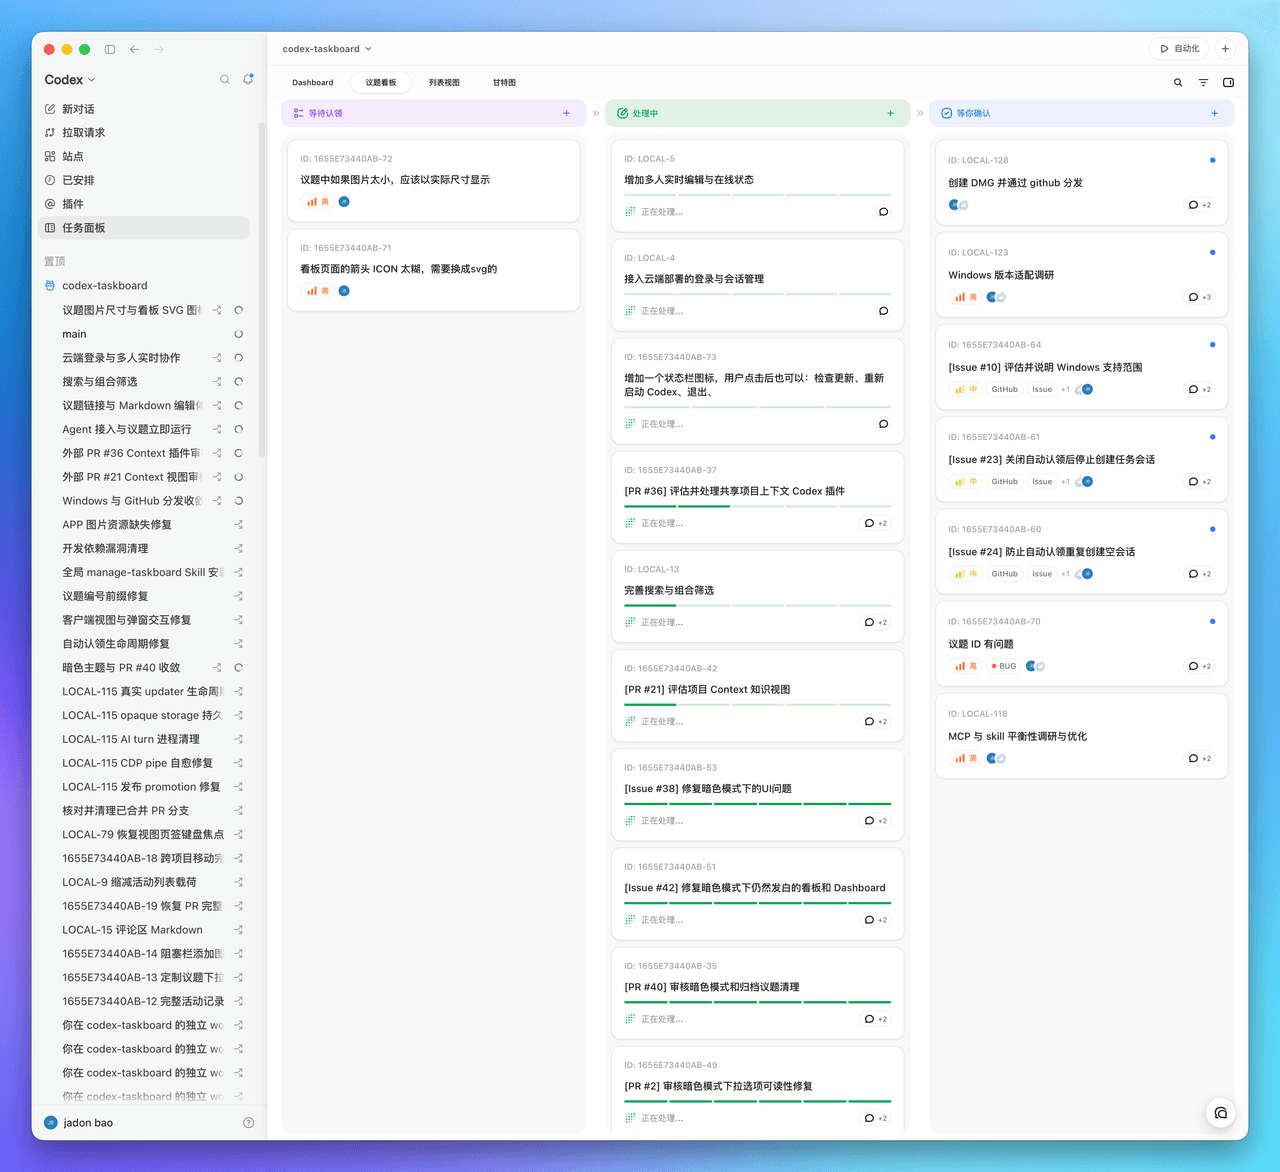
现代化可灵活嵌入的任务面板,支持 Codex、DeepSeek Harness
chuspeeism/dashi-taskboard
现代化可灵活嵌入的任务面板,支持 Codex、DeepSeek Harness
-
 zhoushoujianwork/easyeda-agent
嘉立创EDA专业版(EasyEDA Pro)自动化:给 AI harness 装上画板的「手」—— 一套 typed 原理图/PCB 动作,CLI / Agent Skill / stdio MCP 三形态融合接入。承接嘉立创「不以卖板赚钱…
zhoushoujianwork/easyeda-agent
嘉立创EDA专业版(EasyEDA Pro)自动化:给 AI harness 装上画板的「手」—— 一套 typed 原理图/PCB 动作,CLI / Agent Skill / stdio MCP 三形态融合接入。承接嘉立创「不以卖板赚钱…
-
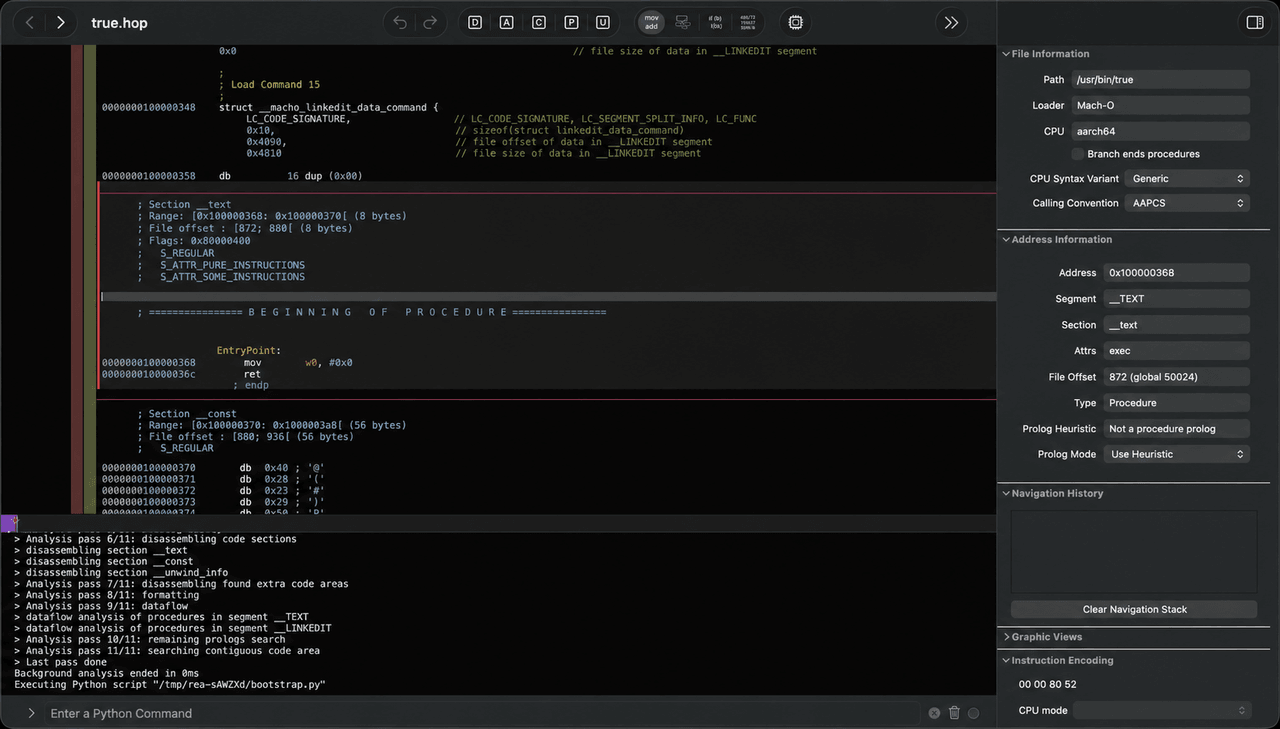 morluto/rea
Reverse engineer anything with agents, from app behavior down to native binaries.
morluto/rea
Reverse engineer anything with agents, from app behavior down to native binaries.
-
 linhay/harmony-next.skills
Offline HarmonyOS NEXT developer skill library for AI coding assistants. Covers API 12–26 declarations, ArkTS/ArkUI, NDK…
linhay/harmony-next.skills
Offline HarmonyOS NEXT developer skill library for AI coding assistants. Covers API 12–26 declarations, ArkTS/ArkUI, NDK…
-
 liceses/dsh-gitbash-preset
DeepSeek Harness 插件:一键安装「极简模式 (Git Bash)」agent preset —— 把 DSH 自带极简模式中的 bash 调用映射到 Git for Windows 的 bash(MSYS),让 Window…
liceses/dsh-gitbash-preset
DeepSeek Harness 插件:一键安装「极简模式 (Git Bash)」agent preset —— 把 DSH 自带极简模式中的 bash 调用映射到 Git for Windows 的 bash(MSYS),让 Window…
-
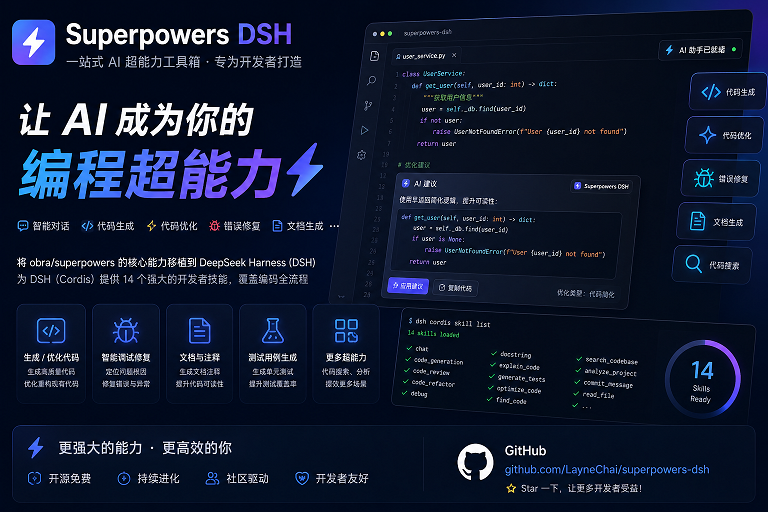 LayneChai/superpowers-dsh
Superpowers skills for DeepSeek Harness: TDD, debugging, planning, and collaboration skills adapted from obra/superpower…
LayneChai/superpowers-dsh
Superpowers skills for DeepSeek Harness: TDD, debugging, planning, and collaboration skills adapted from obra/superpower…
-
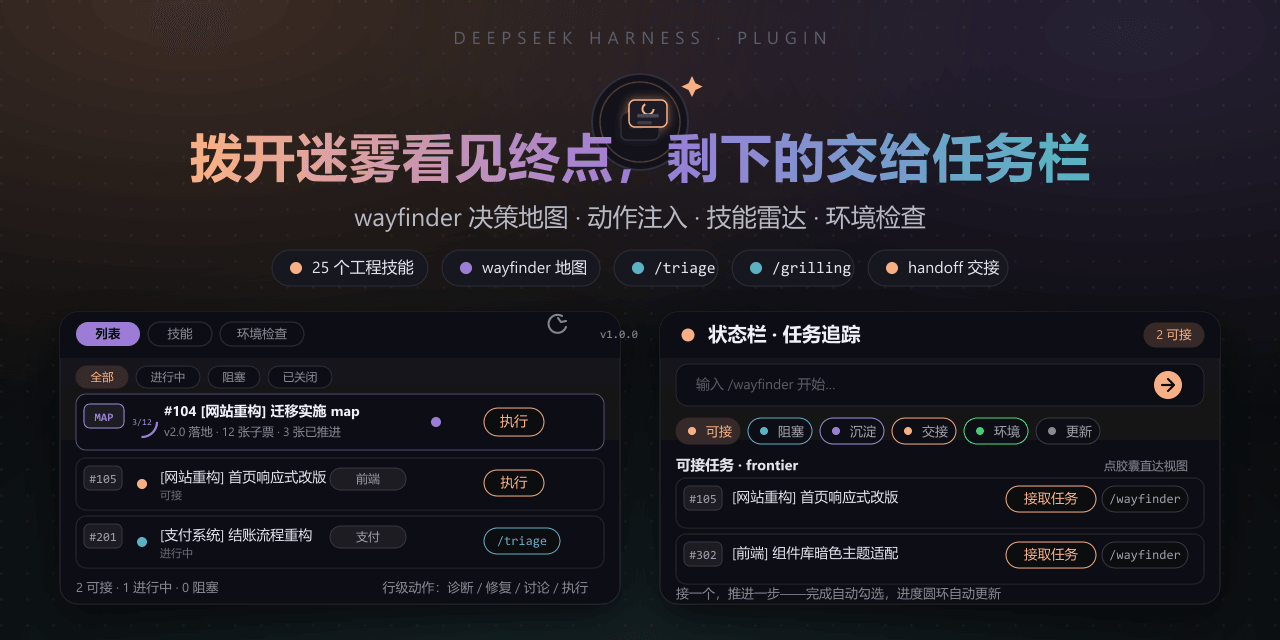 FeatherHunter/dsh-mattpocock-skills-deck
Matt Pocock 技能面板(DSH Deck):安装即自带 25 个工程与效率技能(mattpocock/skills v1.2.3:triage、grilling、wayfinder、handoff 等),右侧面板直接调用,无需手动…
FeatherHunter/dsh-mattpocock-skills-deck
Matt Pocock 技能面板(DSH Deck):安装即自带 25 个工程与效率技能(mattpocock/skills v1.2.3:triage、grilling、wayfinder、handoff 等),右侧面板直接调用,无需手动…
-
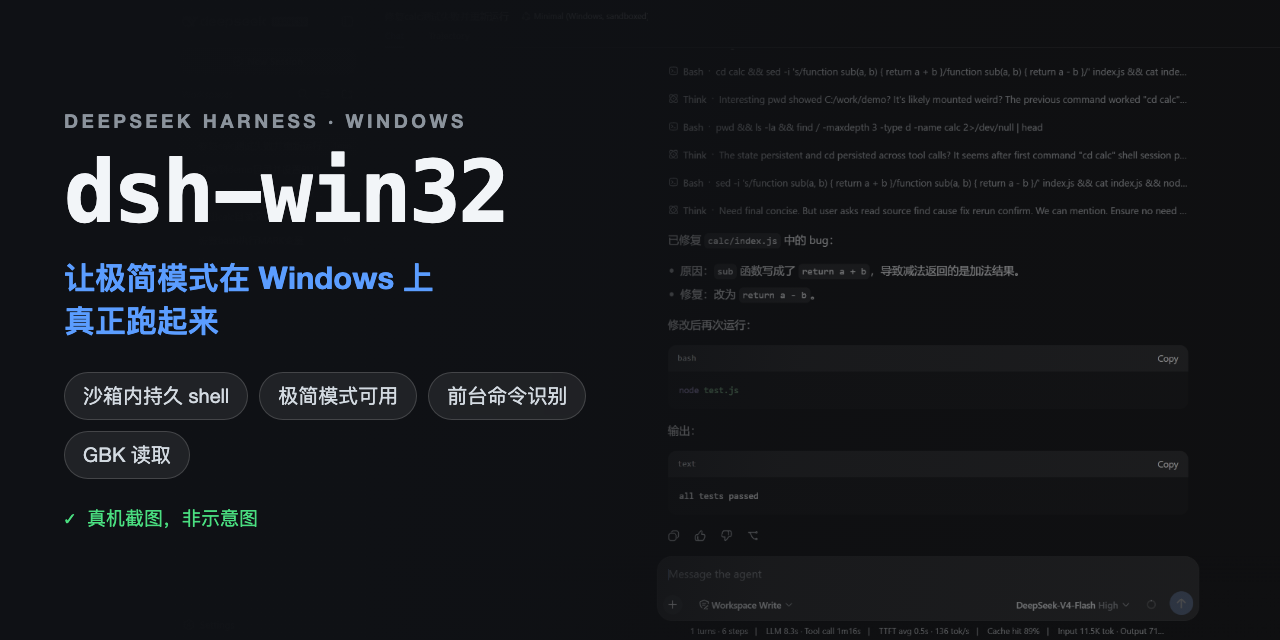 sjh9714/dsh-win32
Fix and diagnose DeepSeek Harness on native Windows. Official PowerShell, Workspace Write, shortcuts, and legacy preset …
sjh9714/dsh-win32
Fix and diagnose DeepSeek Harness on native Windows. Official PowerShell, Workspace Write, shortcuts, and legacy preset …