feiyang-dev/dsh-usage-plugin
DeepSeek Harness 用量与消耗插件(dsh-usage-plugin)—— 每次调用的 token 用量/缓存命中统计、峰谷计费、余额查询、CSV/JSON/PNG 导出,可经桌面端一键安装或命令行 dsh plugin add 安装。
Project Overview项目介绍
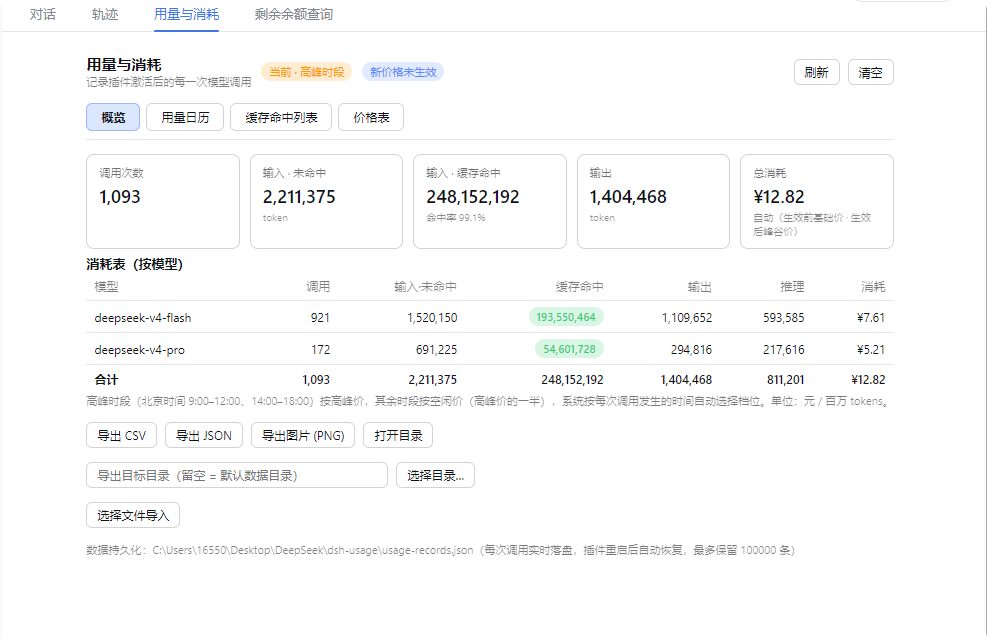
dsh-usage-plugin is a community-made native plugin built exclusively for the DeepSeek Harness ecosystem. It ships as a combined host and client package that installs directly into DSH, adding two new functional tabs to the DSH web UI: “Usage & Cost” and “Balance Query”. The plugin tracks token usage, cache hits, and billing cost for every model call made through DSH, calculates cost based on DeepSeek’s official peak and off-peak pricing schedule aligned to Beijing working hours, and natively handles file paths for all three major desktop operating systems. To install, you can run the command from your terminal, or install it with one click from the DeepSeek Harness Desktop recommended plugins list.
After installation, the plugin automatically logs all model calls you make through DSH, groups usage and cost statistics by model and API provider, and lets you filter aggregated stats by any custom date range you select. The included interactive usage calendar heatmap lets you click any day to pull up a full list of all calls made that day, along with a clear breakdown of peak and off-peak costs for that day. Interrupted, errored, or timed-out calls are clearly marked with an “Interrupted” badge and counted as zero cost, keeping your total call count aligned with the official DeepSeek console even when those calls are not billed. All stats are stored locally so you can access them any time without an extra network call.
This plugin is released under the permissive MIT open source license, and requires Node.js version 18 or higher to run correctly when installed via the command line. If you run into issues connecting to the public npm registry during installation, you can switch to a community mirror registry like npmmirror.com and retry the install command. All usage statistics are stored locally on your machine in a dedicated plugin directory, so no usage data is automatically uploaded to external third-party servers. Common troubleshooting tips are included in the project README for common issues like missing pnpm or leftover package references after uninstall.
这是专为DeepSeek Harness开发的原生插件,功能是记录每一次模型调用的token用量并计算对应的计费成本。插件安装后会在DSH的网页界面新增「用量与成本」和「余额查询」两个标签页,支持按北京时间区分峰谷时段计费,自带月度用量热力图,还支持将统计数据导出为CSV、JSON和PNG格式,可在Windows、macOS和Linux全平台运行,适配各操作系统的原生路径处理规则。
插件会记录每次调用的token用量、缓存命中情况和结束原因,按模型和API提供商分组汇总统计,支持按日期范围筛选统计数据,点击热力图上的日期可查看当日的详细调用记录。对于中断、出错或超时的调用也会如实记录,并标注为未计费,保证统计的调用次数和DeepSeek官方控制台一致。适合需要跟踪DeepSeek API调用成本、核对账单的DSH用户使用。
本插件遵循MIT开源许可协议,可通过DSH的命令行dsh plugin --profile web add @feiyang666/dsh-usage-plugin安装,也可在DeepSeek Harness桌面客户端的推荐插件分区一键安装。它要求Node.js版本不低于18,如果遇到安装网络问题,可切换npm镜像源重试。插件数据存储在本地专属目录,不会自动上传到第三方服务器。
请帮我安装这个 DSH 插件。安装前先完成【兼容性检查 + 安全性检查】,检查通过再动手。

插件:dsh-usage-plugin(feiyang-dev/dsh-usage-plugin)
仓库:https://github.com/feiyang-dev/dsh-usage-plugin
本站详情页:https://www.yhbd.top/plugins/feiyang-dev-dsh-usage-plugin/
本站登记:类型 client · 归类 原生 DSH 插件 · 许可证 MIT · ⭐ 37 · 最近提交 2026-09-24 · 主语言 JavaScript

按下面顺序执行,每步先把结论告诉我,再进入下一步:

【1 兼容性检查】
① 我这边:DSH 版本、Node 版本、操作系统、当前 profile(web / desktop)。
② 读它的 README、package.json、插件 manifest,列出它要求的 DSH 版本 / Node 版本 / 操作系统 / 外部依赖 / 需要另外先装的运行时。
③ 逐条比对,结论只写「满足 / 不满足 / 未知」三种;不满足的给出可行替代方案。
④ 检查是否和我已装的插件冲突:命令名重复、skill / tool 重名、端口占用、重复注册的 MCP server。

【2 安全性检查】
① 仓库可信度:和上面「本站登记」是否一致;star / fork 数、创建时间、最近提交,是否归档或长期停更。
② 安装脚本:逐行看 package.json 的 preinstall / install / postinstall,以及 install.sh、setup.ps1 之类脚本。出现 curl|bash、下载后直接执行、混淆代码、访问与插件功能无关的域名,立刻停下来告诉我,不要继续装。
③ 依赖:列出新增依赖,标出无人维护、或与知名包拼写近似的可疑包(typosquatting)。
④ 权限与副作用:它会读写哪些目录、访问哪些域名、需要哪些 DSH 权限(filesystem / network / shell / clipboard 等),以及怎么卸载和回滚。
⑤ 如果它要求 sudo / 管理员权限,或权限明显超出功能所需,先停下来问我。

【3 安装】
上面两步没有「不满足」和「高危项」时才执行;用官方推荐方式安装,不要自行提权。

【4 汇报】
用表格输出:检查项 / 结论 / 依据 / 是否需要我决策。拿不准的一律写「未知」并说明要我怎么确认——不要猜,也不要替我决定。
Send this message to DSH in your current session: it verifies compatibility and security first (answering met / not met / unknown item by item) and only installs once everything checks out — it will stop and ask you if it finds a high-risk item. The box scrolls; the copy is the full prompt. CLI install commands may not be accurate across systems, so DSH is the safer route.把上面这条消息直接发给当前会话里的 DSH:它会先核对兼容性与安全性(逐条给「满足 / 不满足 / 未知」),确认没问题再安装,有高危项会停下来问你。框内可滚动,复制到的是完整提示词;安装命令不一定准确,发给 DSH 更稳。
- 37 stars - an early-stage project星标 37,属于早期项目
- Desktop client: installation downloads an executable - verify the publisher and checksums桌面客户端:安装会下载可执行文件,请核对发布者与校验和
DSH walks through these 9 checksDSH 会逐条核对这 9 项
Compatibility兼容性
- DSH, Node, OS and profile requirementsDSH 版本 / Node 版本 / 操作系统 / profile 是否满足要求
- External dependencies and runtimes (Electron / Python / Docker, ...)外部依赖与运行时(Electron / Python / Docker 等)是否齐备
- Conflicts with installed plugins: command names, skill / tool names, ports, duplicate MCP registration与已装插件是否冲突:命令名、skill / tool 重名、端口占用、重复 MCP 注册
Security安全性
- Repo matches the facts registered here; archived or abandoned?仓库是否与页面登记一致,是否归档或长期停更
- Safety of preinstall / install / postinstall and install.sh / setup.ps1preinstall / install / postinstall 与 install.sh、setup.ps1 是否安全
- curl|bash, download-then-execute, obfuscation, unrelated domains → stop immediatelycurl|bash、下载即执行、混淆代码、无关域名 → 立刻停止
- Typosquatting or unmaintained packages among the new dependencies新增依赖里有没有 typosquatting 或无人维护的包
- Requested permissions vs. what the feature actually needs申请了哪些权限、是否超出功能所需(filesystem / network / shell / clipboard)
- Any sudo / admin requirement, plus uninstall and rollback是否要求 sudo / 管理员权限,以及卸载与回滚方式
Anything uncertain must be marked unknown with a note on how to confirm it. This site's signal screen is a static snapshot, not a security audit.拿不准的必须标「未知」并说明要我怎么确认。本站的信号筛查是静态快照,不能替代安全审计。
Or use CLI install (for developers)或使用命令行安装(适合开发者)
CLI Install命令行安装
dsh plugin --profile web add @feiyang666/dsh-usage-plugin把 feiyang-dev/dsh-usage-plugin 加入你的 DSH 配置(web profile)即可启用。
READMEREADME
DeepSeek Harness Usage & Cost Tracker (dsh-usage-plugin)
English · 简体中文
A community plugin for DeepSeek Harness — records token usage and cost for every model call, with peak/off-peak billing, balance query, a calendar heatmap, and CSV / JSON / PNG export.



🔔 Important Notice (2026-08-16): npm package renamed
The npm package has been renamed from
@feiyang666/deepseekharnessdesktopto@feiyang666/dsh-usage-plugin(matching the GitHub repofeiyang-dev/dsh-usage-plugin).
- Use the new package name for install / upgrade:
dsh plugin --profile web add @feiyang666/dsh-usage-plugin- The old package
@feiyang666/deepseekharnessdesktopremains published for a while, but it is no longer maintained and will not receive updates — please migrate soon.- The desktop client (
DeepSeek Harness Desktop) supports both package names and will auto-detect old-name installs with a one-click update to the new name.
Overview
dsh-usage-plugin is a usage & cost tracker plugin in the DeepSeek Harness ecosystem (a DSH plugin shipped as a Host + Client two-in-one package). After installation, "Usage & Cost" and "Balance Query" tabs appear in the Web UI, right after "Conversation" and "Trace":
Supports Windows / macOS / Linux: paths are handled per platform (
node:path), and the folder picker / "reveal in file manager" use each OS's native mechanism (macOS:osascript/open; Linux:zenity/xdg-open). Balance query and export do not depend on Windows-only commands.
- Usage & Cost: records each model call's token usage and cache hits (input miss / cache hit / cache write / output / reasoning / finish reason), and computes cost using DeepSeek's peak/valley or base pricing (peak hours on weekdays are automatically priced by Beijing time 09:00–12:00 and 14:00–18:00; since 2026-08-23 weekends are billed entirely at the off-peak rate; since 2026-09-10 12:00 Beijing time the post-V4.1-Flash peak/valley prices apply —
deepseek-flashoff-peak cache hit 0.02 / input 1 / output 4 CNY, peak at twice that). Model names come from the actual request parameters, so non-DeepSeek models are shown truthfully instead of "unknown model"; models without an official price are counted as 0. The overview shows a by-model table plus a by-API-provider × model drill-down (each provider grouped with every model's calls and peak/off-peak cost split) and a grand total row. The overview also supports date filtering (Today / Last 7 days / Last 30 days / All, plus a custom start–end range), so the aggregate stats can be scoped to any single day or date range. - Usage Calendar: a monthly daily-usage heatmap (colored by cost or call count), hover for details including the peak/off-peak cost split, click a day for its call list and peak/off-peak totals, plus a per-day statistics table with peak cost / off-peak cost / total columns and rollups. Supports date-range filtering (Today / 7 days / 30 days / All plus custom start–end dates): when a range is active, the daily stats table shows every day in range across months, the top cards switch to "Calls in range / Cost in range" with range totals, and the heatmap only colors days inside the range.
- Cache Hit List: newest-first, fully scrollable, with quick filters (Today / 7 days / 30 days / All) and custom date ranges; the summary line and footer total split peak vs off-peak consumption with a grand cost total. The list is paginated (100 rows per page), so it stays smooth even with large data volumes.
- Interrupted calls shown truthfully: calls that were aborted / errored / timed out (e.g. manually stopped generation, stream interruption) are shown with a red "Interrupted" badge, the finish reason (Interrupted / Error / Timeout) and a
—cost. The official console still counts these as API requests and bills their actual tokens, but the harness does not report their usage to the plugin — so the plugin records them at 0 tokens, keeping the call count aligned with the official console while costs are unaffected. The Overview's "Calls" card adds a· interrupted N (not billed)hint. - Local stats vs official console: a fixed notice banner at the top of the panel explains that this panel reflects calls captured locally by the plugin (official prices + peak/off-peak hours), and that the official console (platform.deepseek.com usage page) may show a higher amount because: ① interrupted/failed/timed-out calls are still billed by the console while the plugin records them as 0; ② calls from other API keys on your account (other apps/scripts) do not pass through DeepSeek Harness — the console includes them, the plugin does not; ③ for exact reconciliation, export the official monthly billing CSV and compare. When interrupted calls are detected, the banner also shows a red "Current records include N interrupted call(s) (not billed)" line.
- Price Table: the official DeepSeek API price table (covering
deepseek-flash= DeepSeek-V4.1-Flash anddeepseek-v4-pro; the legacy idsdeepseek-v4-flash/deepseek-v4-flash-vision-expstay callable and fold into the Flash tier) — base and peak/valley unit prices shown side by side (peak vs off-peak). The peak/off-peak tables are date-split: the first version applies from 2026-08-17, and the post-V4.1-Flash version applies from 2026-09-10 12:00 Beijing time (deepseek-flashoff-peak lowered to cache hit 0.02 / input 1 / output 4 CNY, peak at twice that;deepseek-v4-prounchanged) — past calls are always billed with the version in force at their own time. Editable in-panel and persisted topricing.json, with a reset-to-default option. - Balance Query: queries your DeepSeek account balance using the configured
DEEPSEEK_API_KEY. - Export: CSV / JSON / PNG long image (newest-first, up to the latest 2000 records, warns if exceeded; the PNG report includes peak/off-peak cost columns), to any directory (native picker), auto-opens the folder after export.
- Import: merge-imports JSON / CSV files, deduplicated by time.
- Persistence: records are written live to
<session workspace>/dsh-usage/usage-records.jsonand restored on restart (cap 100000 records). - UI adaptation: panel typography scales with the app's display-size setting (em-relative fonts); wide tables scroll horizontally on desktop (
max-content+overflow-x) and fit the screen width on mobile (≤900px, no horizontal scrollbar); popup cards adapt to the viewport. - English UI (i18n): the panel follows the harness's own language setting (General Settings → Language) — switch it there and the plugin follows instantly, no separate toggle, no
localStorageoverride. The bilingual dictionary covers the whole panel, the peak/off-peak billing-period hints, the balance query and the PNG report; host-level Conversation/Settings tab labels are re-read per render, so they follow the language switch live. - Per-message token popup: when a turn finishes, the assistant message's footer action row shows a "Turn tokens" button; clicking opens a
Token Detailspopup in two layers — Conversation total (the whole session's total tokens / total cost / run time / cache-hit rate) and This turn (this output's tokens, turn tokens, turn cost, turn duration, turn cache-hit rate, a cache-hit bar, and per-model cards showing each model's input·miss / cache hit / output (+ reasoning) plus its peak/off-peak cost split). Durations are shown asXm Ys. Each usage record is tagged with the conversation (sessionId), so per-turn and per-conversation stats are computed independently. - Internal/tool calls grouped separately: internal/placeholder calls (e.g.
dsh2shell-*with modelfake) are excluded from the model cost breakdown and collected in a collapsible "Tool calls (internal)" group below the breakdown, so only real model calls count in the cost tables. - Mobile adaptation: tables fit the screen width on ≤900px (no horizontal scrollbar); wide tables collapse the middle columns; the popup and its stat cards / per-model cards adapt to the viewport.
Showing the opening section of the README — the full document lives in the repository以上为 README 开头摘要,完整文档在仓库内 · View the full README on GitHub →在 GitHub 查看完整 README →
Related相关推荐
-
 nonewind/dsh-spend
Token usage & cost monitor for DeepSeek Harness — floating widget with multi-dimensional stats, time-series charts, auto…
nonewind/dsh-spend
Token usage & cost monitor for DeepSeek Harness — floating widget with multi-dimensional stats, time-series charts, auto…
-
 raphael-y7/dsh-desktop-statusbar
把 DSH 桌面端底部的统计行换成可配置状态栏:10 个字段可选可排序,按 DeepSeek 官方峰谷口径估算费用,支持自定义模型单价与账户余额。非商业许可。
raphael-y7/dsh-desktop-statusbar
把 DSH 桌面端底部的统计行换成可配置状态栏:10 个字段可选可排序,按 DeepSeek 官方峰谷口径估算费用,支持自定义模型单价与账户余额。非商业许可。
- zoumutou/dsh-cost-balance DeepSeek Harness 插件:输入框下方 iOS 风格统计条——会话花费、账户余额、缓存命中、Token 用量一键展开
-
 MeteorNOX/DeepSeek-Balance-Whale-Widget
DeepSeek Harness(DSH)一只住在 DSH 界面右下角的小鲸鱼娘,帮你盯着DeepSeek账户余额。QQ弹弹,支持拖拽吸附、左吸附翻转、数字滚动动画,随界面自动启用,建议直接喊来你的dsh安装
MeteorNOX/DeepSeek-Balance-Whale-Widget
DeepSeek Harness(DSH)一只住在 DSH 界面右下角的小鲸鱼娘,帮你盯着DeepSeek账户余额。QQ弹弹,支持拖拽吸附、左吸附翻转、数字滚动动画,随界面自动启用,建议直接喊来你的dsh安装
-
 wssfk12138/dsh-damage-pulse
DeepSeek Harness Token 余额监控插件:鲸鱼娘待机/扣费/复苏动画、峰谷计费、连续扣费飘字与会话费用统计。
wssfk12138/dsh-damage-pulse
DeepSeek Harness Token 余额监控插件:鲸鱼娘待机/扣费/复苏动画、峰谷计费、连续扣费飘字与会话费用统计。
-
 Ychris12138/dsh-usage-stats
Provider balances, subscription quotas, and token-usage analytics for the DeepSeek Harness Web GUI (dsh web).
Ychris12138/dsh-usage-stats
Provider balances, subscription quotas, and token-usage analytics for the DeepSeek Harness Web GUI (dsh web).
-
 JingbiaoMei/Tokdash
Agent Dashboard: Visualization and analytics for Sessions and Quota Usage. Track, analyze, and optimize token usage acro…
JingbiaoMei/Tokdash
Agent Dashboard: Visualization and analytics for Sessions and Quota Usage. Track, analyze, and optimize token usage acro…
-
 yxxbc/dsh-balance-plugin
deepSeek 余额监控与用量统计(DSH 动态 Cordis 插件):余额监控 · 官方充值入口 · 用量统计 · 三方插件管理
yxxbc/dsh-balance-plugin
deepSeek 余额监控与用量统计(DSH 动态 Cordis 插件):余额监控 · 官方充值入口 · 用量统计 · 三方插件管理