
jackma5477001/dsh-system-monitor
DeepSeek 钳制系统监控器
项目介绍Project Overview
dsh-system-monitor 是一款 DSH Web 插件,通过 Node.js 内置 os 模块采集并每 5 秒在浏览器右上角显示运行 DSH 服务端电脑的 CPU 使用率、内存使用率及内存已用/总容量,支持 GB/MB 自动单位切换。基于两次 CPU 时间差计算 CPU 占比,仅读取本机硬件资源,不涉及对话、文件或网络数据。插件可通过 pnpm add 本地路径安装,并在 cordis.patch.yml 的 insert 列表中注册。服务端或接口异常时前端显示占位符 --,首次 CPU 采样可能为 null。提供 GET /api/dsh-system-monitor/stats 接口与 smoke.mjs、client-sim.mjs 两套测试脚本。
dsh-system-monitor is a DSH Web plugin that samples and displays the host machine's CPU usage, memory percentage, and used/total memory in the top-right corner of the browser, refreshing every 5 seconds via Node.js's built-in os module. It calculates CPU usage from the delta between two CPU time samples, reads only local hardware data, and never touches conversation content, files, or network traffic. Install with pnpm add to a local path, then register the id in cordis.patch.yml. When the service or API is unavailable, the UI shows a placeholder; the first CPU sample may be null. It exposes GET /api/dsh-system-monitor/stats and includes smoke and client simulation tests.
请帮我了解并安装插件:【dsh-system-monitor】【https://github.com/jackma5477001/dsh-system-monitor】把上面这条消息直接发给当前会话里的 DSH,让它帮你了解并安装。安装命令不一定准确,发给 DSH 更稳。Send this message to DSH in your current session. CLI install commands may not be accurate across systems — DSH will figure it out for you.
或使用命令行安装(适合开发者)Or use CLI install (for developers)
命令行安装CLI Install
dsh plugin --profile web add github:jackma5477001/dsh-system-monitor把 jackma5477001/dsh-system-monitor 加入你的 DSH 配置(web profile)即可启用。
READMEREADME
dsh-system-monitor
dsh-system-monitor 是一个 DSH Web 插件,用于显示运行 DSH 的电脑的实时硬件运行信息:
- CPU 使用率
- 内存使用率
- 内存已用容量 / 总容量
插件只采集 DSH 服务端所在电脑的本机资源,不读取对话内容、文件内容或网络数据。
页面位置
信息显示在 Web GUI 右上角,并分为上下两行:
┌──────────────────────────────────────────────────────────────┐
│  会话标题 …                                  [Session log] [余额] │
│                                             CPU 23% · MEM 58% · 8.2GB/16.0GB │
└──────────────────────────────────────────────────────────────┘
上行保留 DSH 原有的 Session log 和余额按钮,下行右对齐显示系统监控数据。
实际效果:

工作方式
- 服务端使用 Node.js 内置的
os模块采集 CPU 和内存数据,不引入第三方运行时依赖; - 服务端每 5 秒更新一次采样结果;
- 浏览器端每 5 秒请求一次统计接口并刷新显示;
- 服务端或接口暂不可用时,界面显示
--,恢复后自动更新; - CPU 使用率通过两次 CPU 时间采样的差值计算。
安装
以 Web profile 为例:
cd ~/.dsh/profiles/web
pnpm add /path/to/dsh-system-monitor
也可以直接安装本地目录:
pnpm add D:/App/code/Project/dph/default/dsh-system-monitor
然后在 ~/.dsh/profiles/web/cordis.patch.yml 的 insert 列表中加入:
- id: dsh-system-monitor
  name: dsh-system-monitor
重启 dsh web 服务并刷新浏览器页面即可生效。
HTTP 接口
插件注册以下接口:
GET /api/dsh-system-monitor/stats
成功响应示例:
{
  "ok": true,
  "data": {
    "status": "ok",
    "cpu": 23,
    "memPercent": 58,
    "memUsed": 8800000000,
    "memTotal": 16000000000,
    "sampledAt": 1789000000000
  }
}
字段说明:
| 字段 | 说明 |
|---|---|
status |
ok 或 error;错误时前端显示占位符 |
cpu |
0–100 的整数百分比;首次采样建立基准,可能暂为 null |
memPercent |
内存使用率百分比 |
memUsed |
已使用内存,单位为字节 |
memTotal |
总内存,单位为字节 |
sampledAt |
采样时间戳,单位为毫秒 |
容量显示规则:总容量不小于 1GB 时显示 GB 并保留 1 位小数,否则按 MB 取整。
测试
在插件目录执行:
node test/smoke.mjs
node test/client-sim.mjs
其中:
smoke.mjs验证服务端路由、采样数据和清理逻辑;client-sim.mjs验证前端 bundle、slot 注册、两行右对齐布局、轮询和容量格式化。
目录结构
lib/index.js       # 服务端采样与 HTTP 路由
lib/client.js      # 浏览器端组件与右上角布局
test/smoke.mjs     # 服务端测试
test/client-sim.mjs # 浏览器端模拟测试
docs/需求文档.md   # 原始需求文档
许可证
MIT
相关推荐Related
-
 csyangwen/dsh-memory-evolve
为 DeepSeek Harness 带来「跨会话长期记忆 + 后台自我进化」能力的纯插件实现:五轨记忆 · git 分支感知 · 回合内自我审查 · 技能自我进化与技能管理器 · 四轨待办 · COI 调度 · 会话广播 · 会话搜索 ·…
csyangwen/dsh-memory-evolve
为 DeepSeek Harness 带来「跨会话长期记忆 + 后台自我进化」能力的纯插件实现:五轨记忆 · git 分支感知 · 回合内自我审查 · 技能自我进化与技能管理器 · 四轨待办 · COI 调度 · 会话广播 · 会话搜索 ·…
-
 Nagi-ovo/dsh-find-plugins
帮 DSH 搜索、安装并验证插件的 Skill|A DSH skill that finds, installs, and verifies GitHub plugins
Nagi-ovo/dsh-find-plugins
帮 DSH 搜索、安装并验证插件的 Skill|A DSH skill that finds, installs, and verifies GitHub plugins
-
 yyyyukari/dsh-plugin-workshop
Steam Workshop-style plugin browser for the DeepSeek Harness (DSH) Web UI - zero-server: GitHub-powered search, trending…
yyyyukari/dsh-plugin-workshop
Steam Workshop-style plugin browser for the DeepSeek Harness (DSH) Web UI - zero-server: GitHub-powered search, trending…
-
 huey1in/reef
DSH 插件全家桶:浏览器自动化 + MCP Server + GitHub/GitLab 自动评审 + 原生嵌入面板 | One install, five modules for DeepSeek Harness: browser au…
huey1in/reef
DSH 插件全家桶:浏览器自动化 + MCP Server + GitHub/GitLab 自动评审 + 原生嵌入面板 | One install, five modules for DeepSeek Harness: browser au…
-
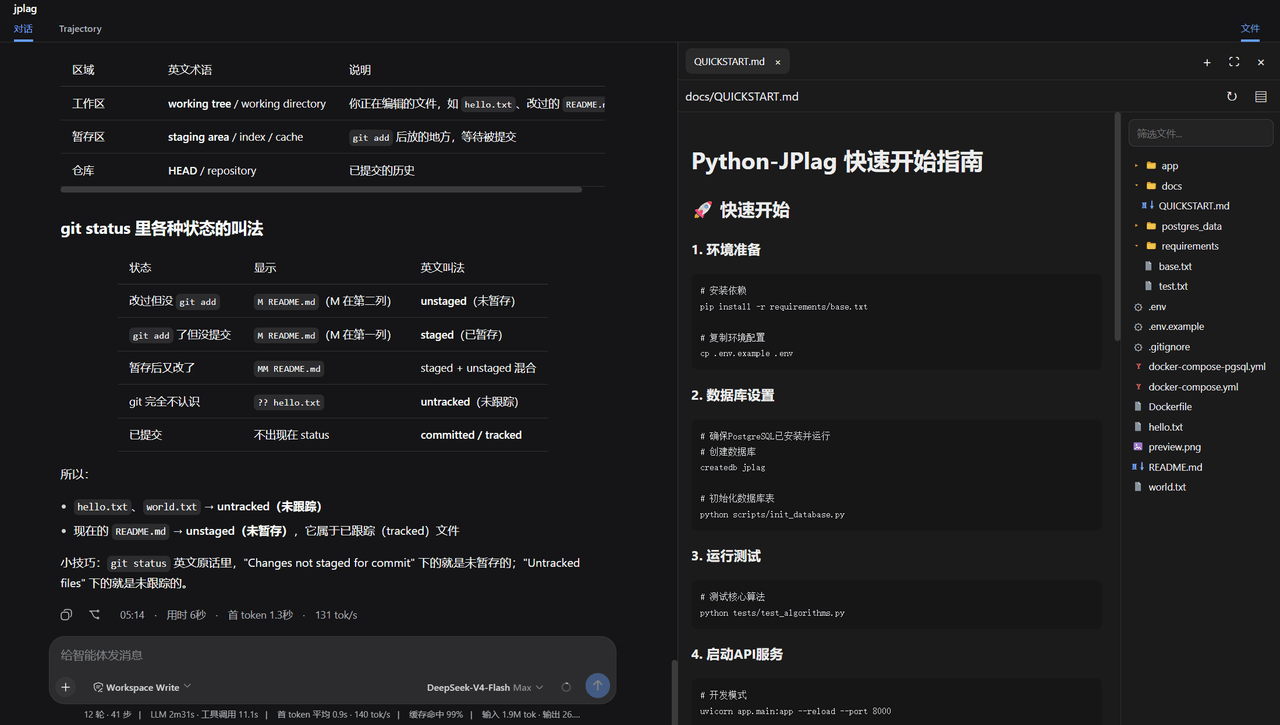 ccq1/dsh-side-panel
DSH 侧边栏,集成文件浏览器、终端和 Git 审查,方便预览文件。
ccq1/dsh-side-panel
DSH 侧边栏,集成文件浏览器、终端和 Git 审查,方便预览文件。
-
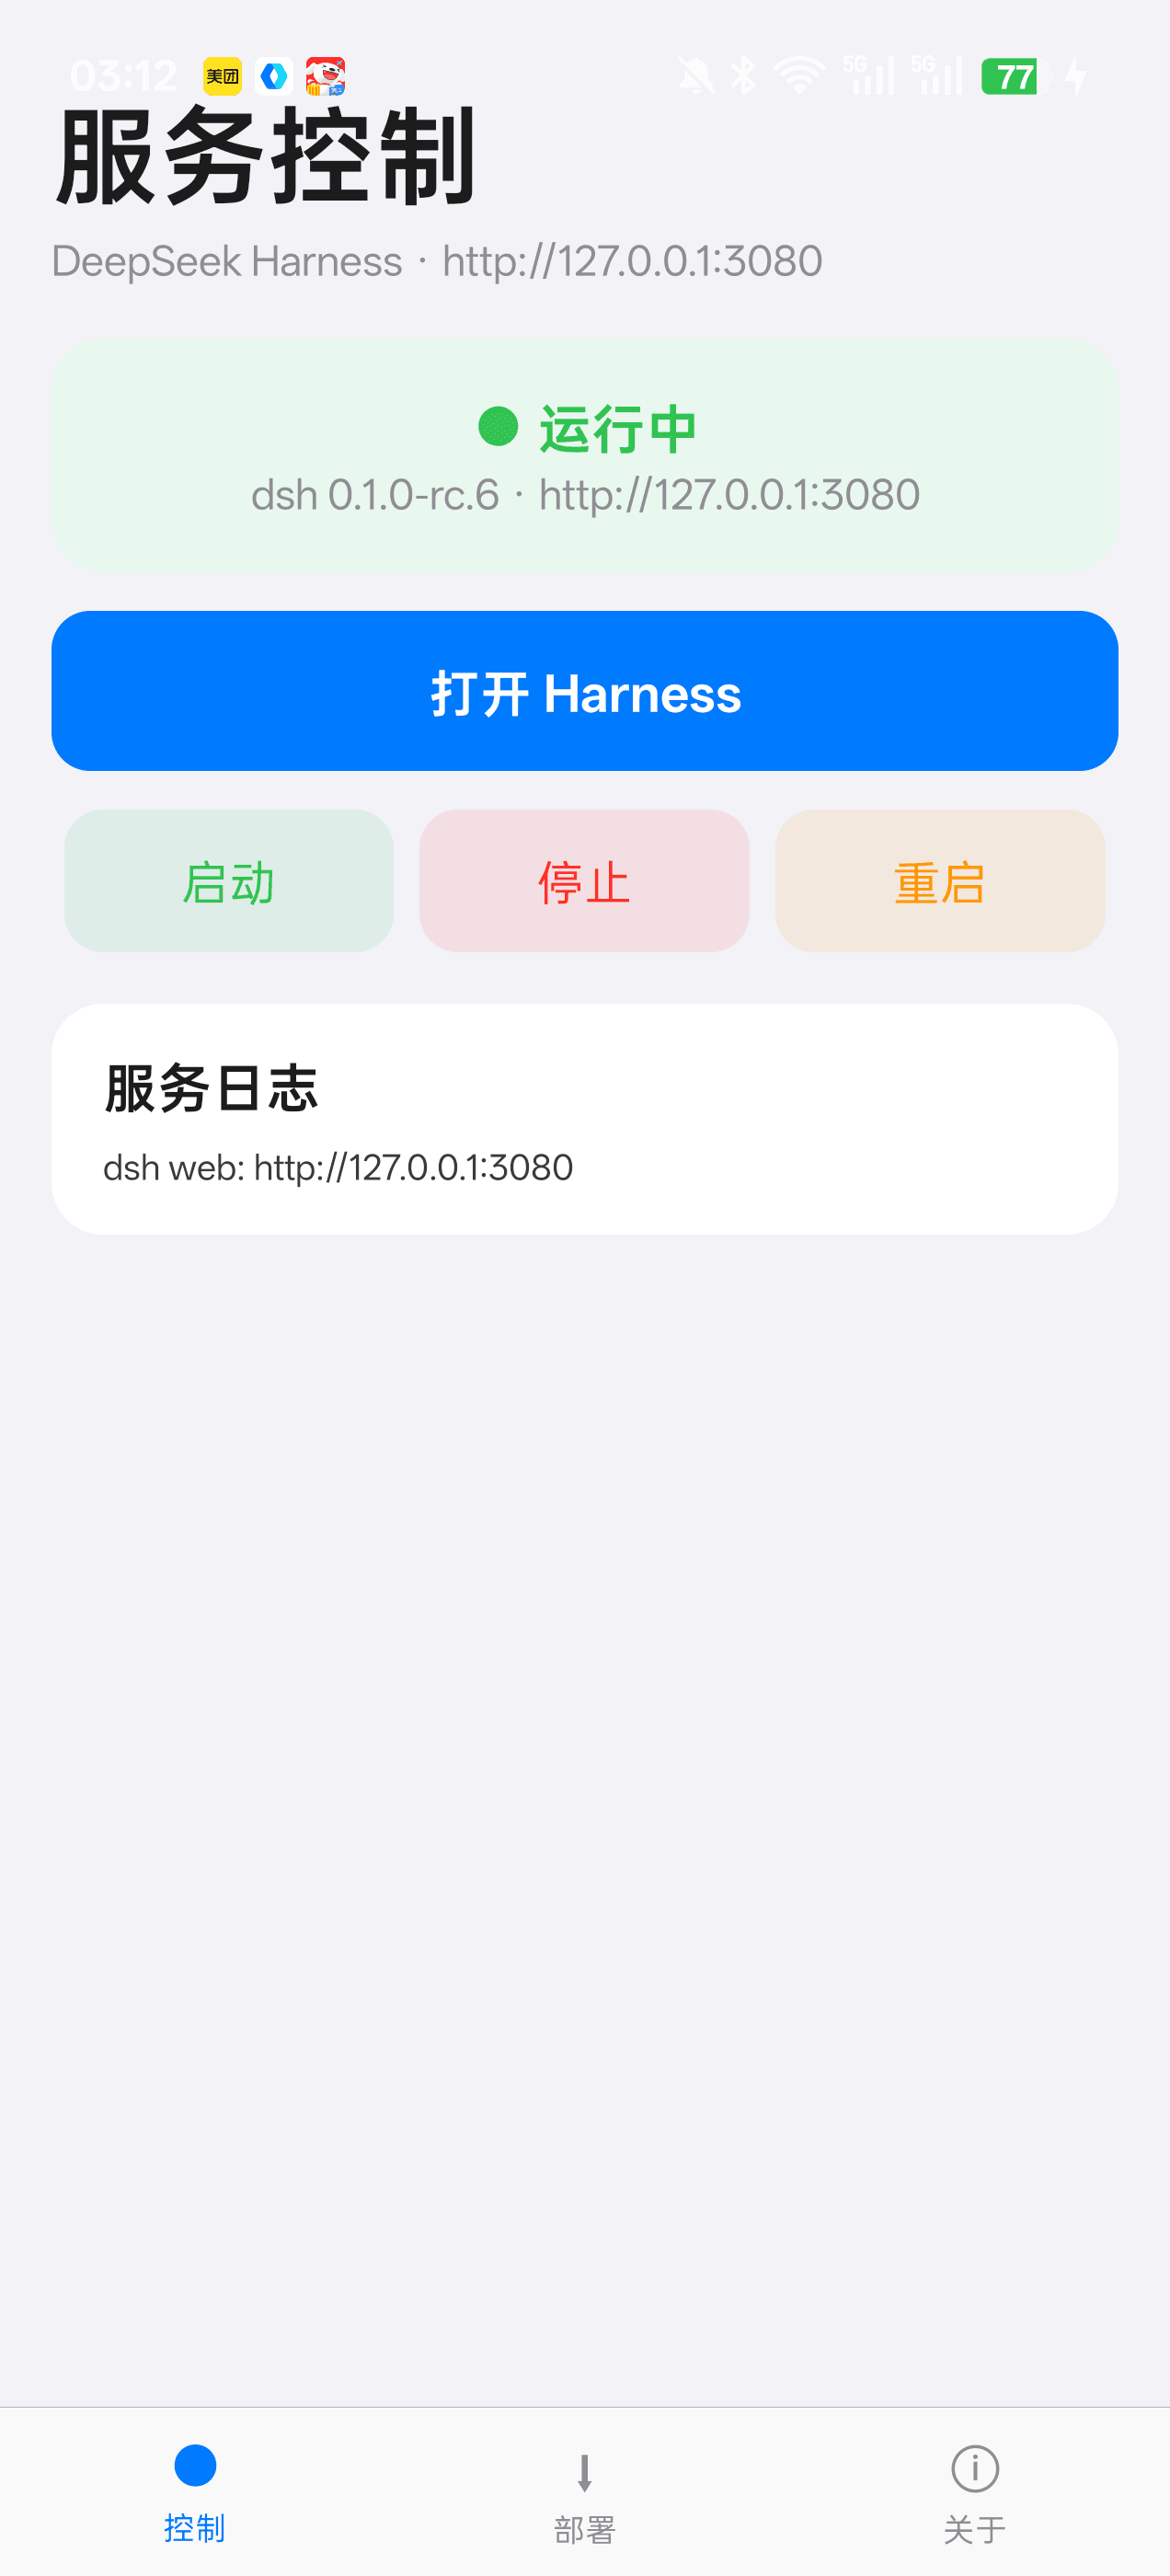 Jensen-Yao/deepseek-harness-android-app
DeepSeek Harness 安卓通用控制端:Termux 引导、一键部署、内置浏览器与存储管理(dsh-plugin 生态)
Jensen-Yao/deepseek-harness-android-app
DeepSeek Harness 安卓通用控制端:Termux 引导、一键部署、内置浏览器与存储管理(dsh-plugin 生态)
-
 PerryLink/dsh-composer-history
Terminal-style input history for the DeepSeek Harness web composer: edge-first arrows with exact draft/caret restore, br…
PerryLink/dsh-composer-history
Terminal-style input history for the DeepSeek Harness web composer: edge-first arrows with exact draft/caret restore, br…
-
 beancookie/dsh-plugin-anydoc
DSH 插件:基于 @firecrawl/anydoc 将 Word、PPT、Excel、PDF、EPUB、CSV 等文档转换为 GitHub-Flavored Markdown
beancookie/dsh-plugin-anydoc
DSH 插件:基于 @firecrawl/anydoc 将 Word、PPT、Excel、PDF、EPUB、CSV 等文档转换为 GitHub-Flavored Markdown