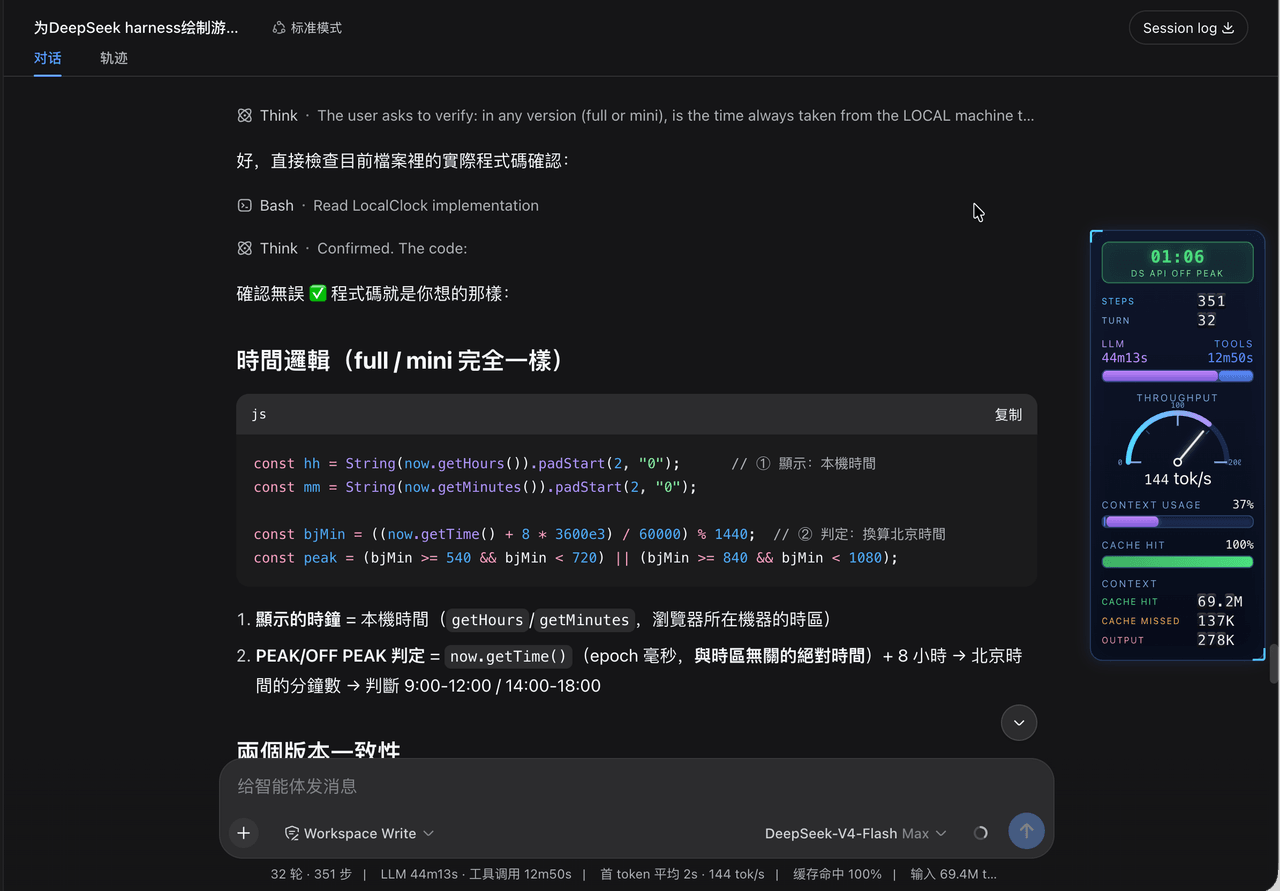
lauytgary/dsh_hud_plugin
DSH 抬头显示面板
项目介绍Project Overview
dsh-stats-hud 是 DeepSeek Harness 的网页端科幻风 HUD 插件,在界面右缘固定竖列展示会话统计:时钟与峰谷电价、步数/回合、LLM 与工具耗时比、吞吐、上下文占用、缓存命中及滚动计数,不改原统计行。适合想实时监控 token、缓存与运行状态时使用。窗口宽低于 800px 会隐藏,窄屏 mini 模式可能轻微遮挡聊天区。
dsh-stats-hud is a sci-fi HUD plugin for the DeepSeek Harness web UI. It adds a fixed vertical panel at the far right showing clock and API peak/off-peak status, steps/turns, LLM-versus-tools time, throughput, context usage, cache-hit rate, and rolling token counters, while leaving the stock stats line untouched. Use it for live session monitoring. Note: it hides below 800px window width, and mini mode may slightly overlap chat on narrow screens.
请帮我了解并安装插件:【dsh_hud_plugin】【https://github.com/lauytgary/dsh_hud_plugin】把上面这条消息直接发给当前会话里的 DSH,让它帮你了解并安装。安装命令不一定准确,发给 DSH 更稳。Send this message to DSH in your current session. CLI install commands may not be accurate across systems — DSH will figure it out for you.
或使用命令行安装(适合开发者)Or use CLI install (for developers)
命令行安装CLI Install
dsh plugin --profile web add dsh-stats-hud把 lauytgary/dsh_hud_plugin 加入你的 DSH 配置(web profile)即可启用。
READMEREADME
English · 简体中文
dsh-stats-hud
A sci-fi HUD for DeepSeek Harness: the session's stats become game-style level bars in a vertical column fixed to the far right edge of the web UI — without touching the original stats line.
Changelog
2026-08-24 — Peak / off-peak windows updated
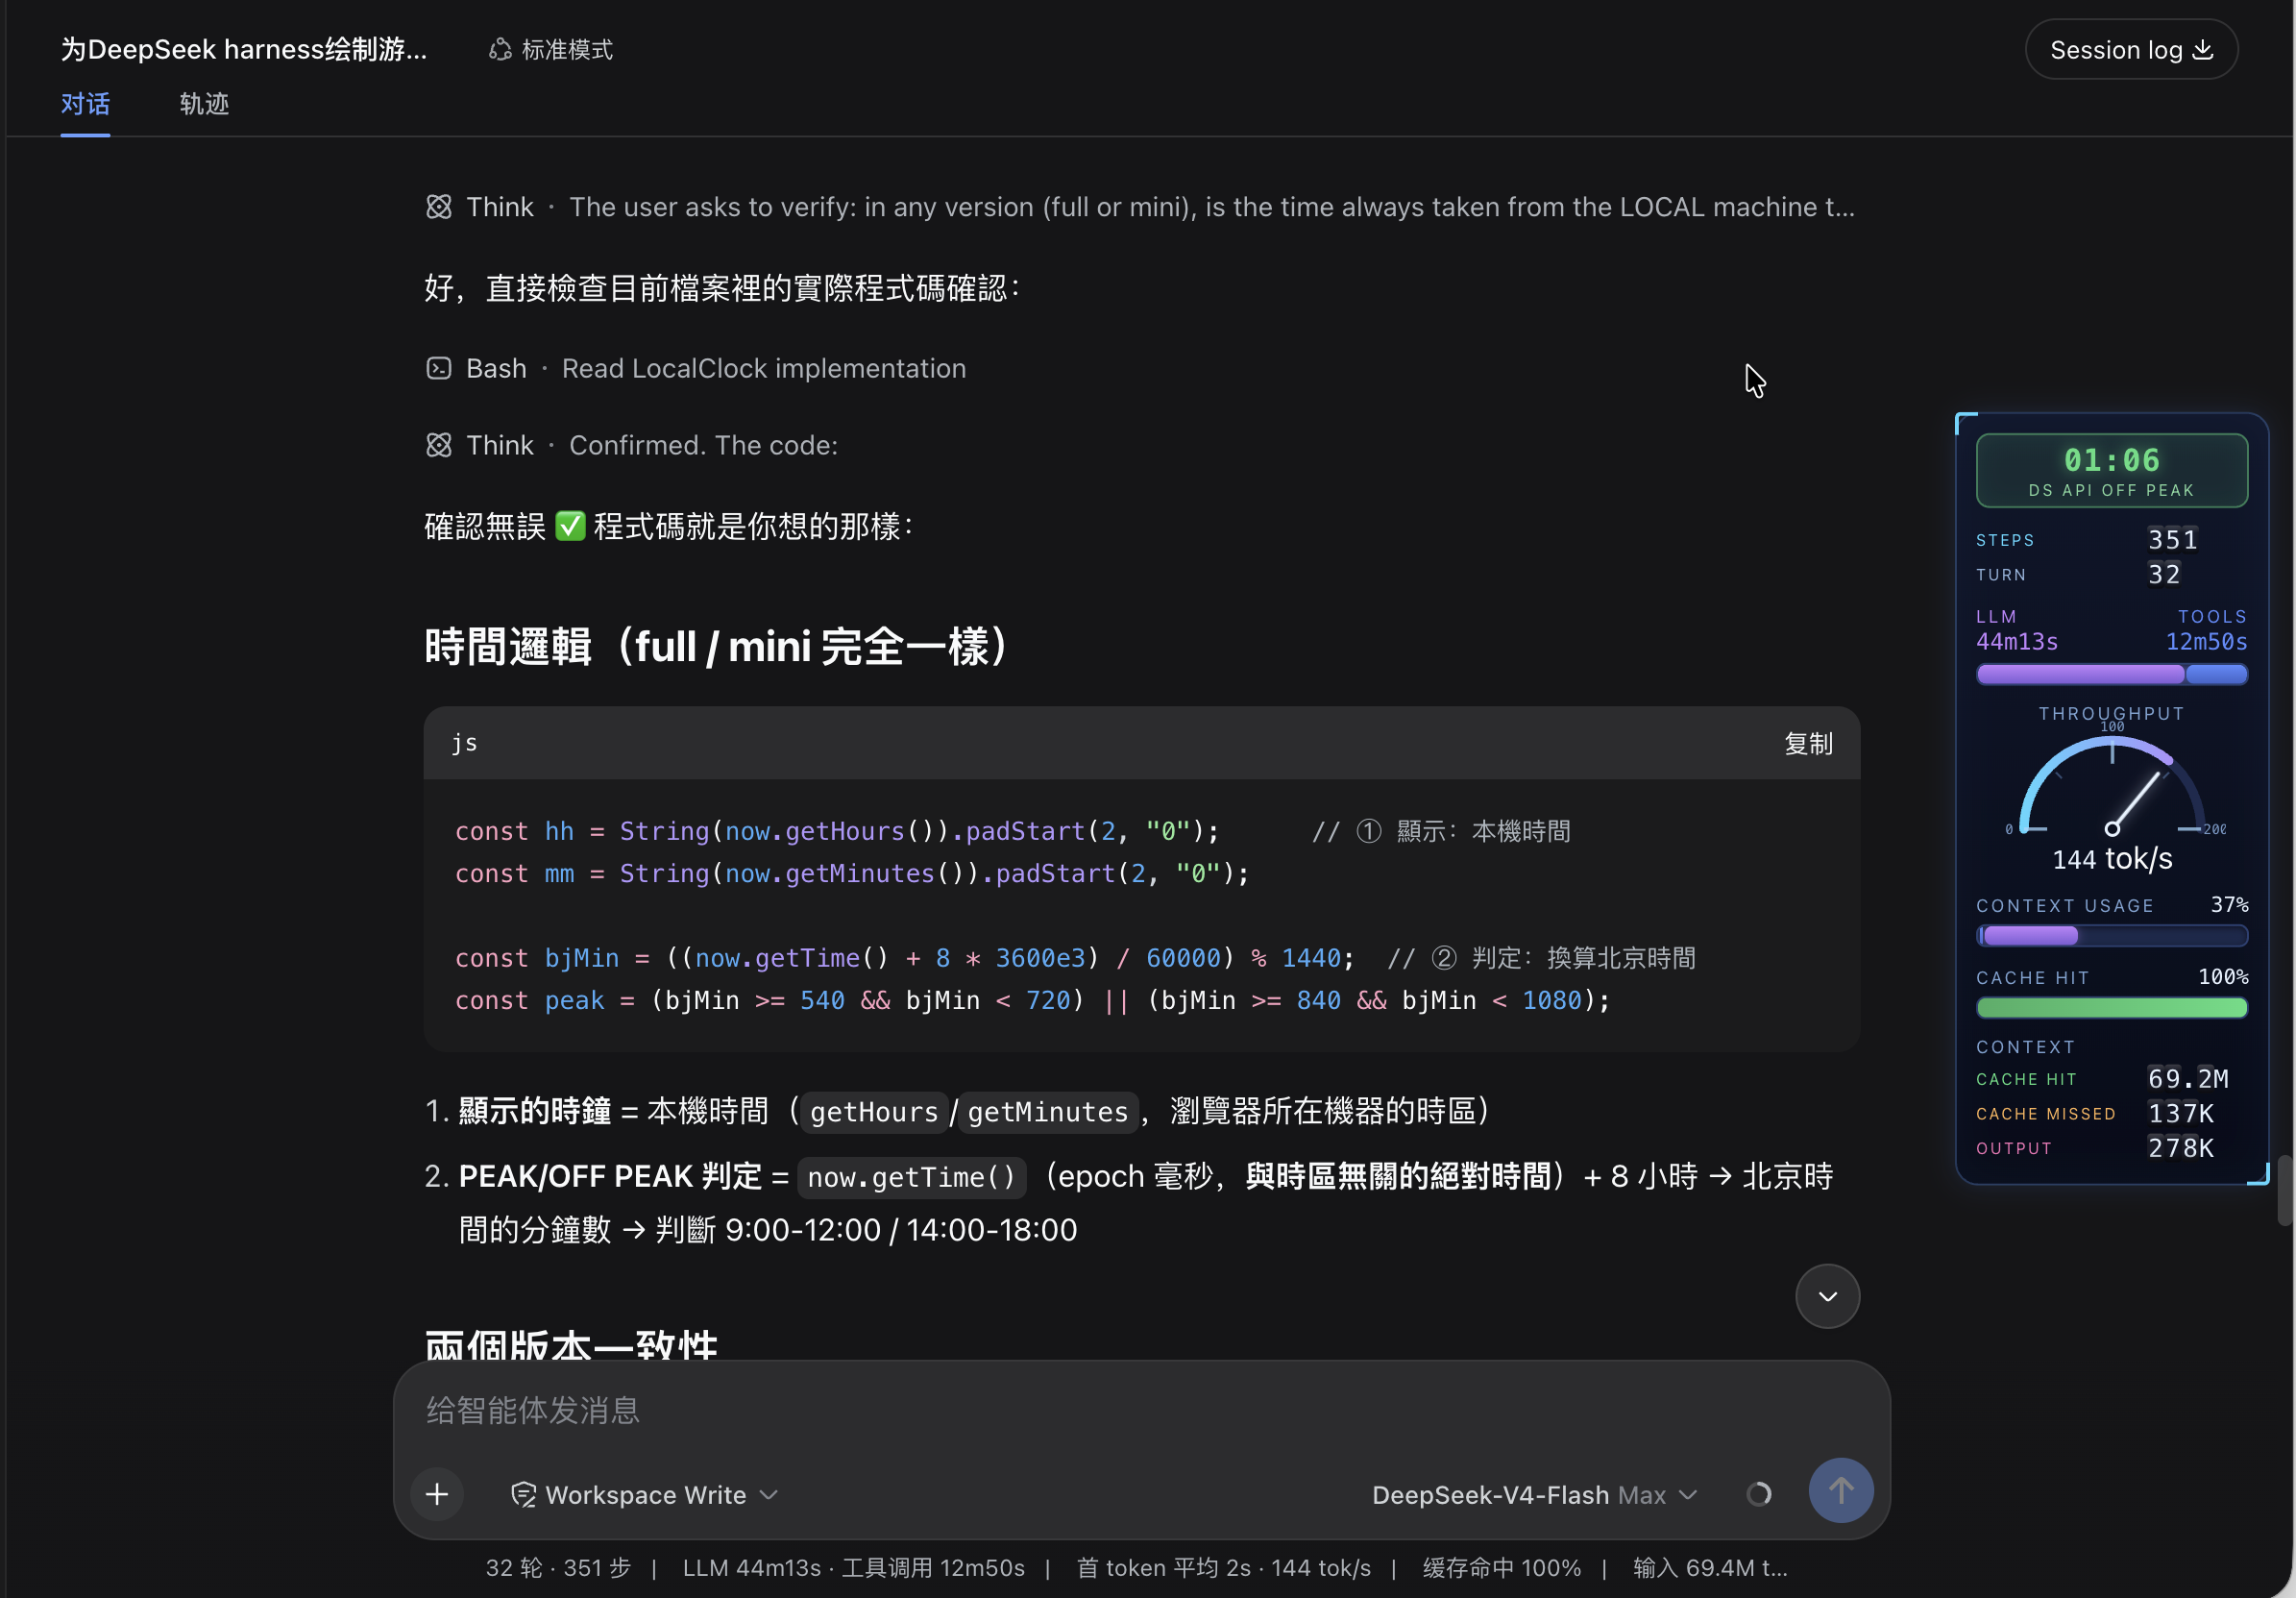
CLOCKbadge now follows the official DeepSeek API peak-valley pricing: peak = Mon–Fri Beijing 09:00-12:00 / 14:00-18:00 (i.e. Mon–Fri 01:00-04:00 / 06:00-10:00 UTC); weekends are always OFF-PEAK (previously weekends inside those windows were wrongly shown as PEAK).- Refactored the check into the pure
isDsApiPeak(date)helper (weekday resolved on the Beijing calendar, so it is correct in any timezone) and exposed it via the test-only__testexport. - Added 3 unit-test groups covering window edges, weekends and the Beijing/UTC day boundary (9 tests total, all green).
- Docs synced (this README,
README-CN.mdand theTuningsection).
Instruments (all-English, LLM terminology)
| Instrument | Data | Full scale | Past full scale |
|---|---|---|---|
CLOCK badge |
Local time (24h) + DS API PEAK / DS API OFF PEAK rate |
Peak = Mon–Fri Beijing 09:00-12:00 / 14:00-18:00 (i.e. Mon–Fri 01:00-04:00 / 06:00-10:00 UTC); weekends and all other hours are OFF-PEAK (half price) | PEAK orange tint, OFF-PEAK green tint |
STEPS / TURN rolling rows |
Steps / turns as odometer drums (like the CONTEXT rows) | — | Drums spin up on mount, roll on change |
LLM / TOOLS dual bar |
Two columns (labels over values), bar segments = raw LLM:TOOLS time ratio | No cap — 2:1 time means 2:1 bar | — |
THROUGHPUT gauge |
tokens/s (throughput), centered title, combined centered readout (146 tok/s) |
Redline auto-scales 200→300→400… (arc ticks follow) | — |
CONTEXT USAGE bar |
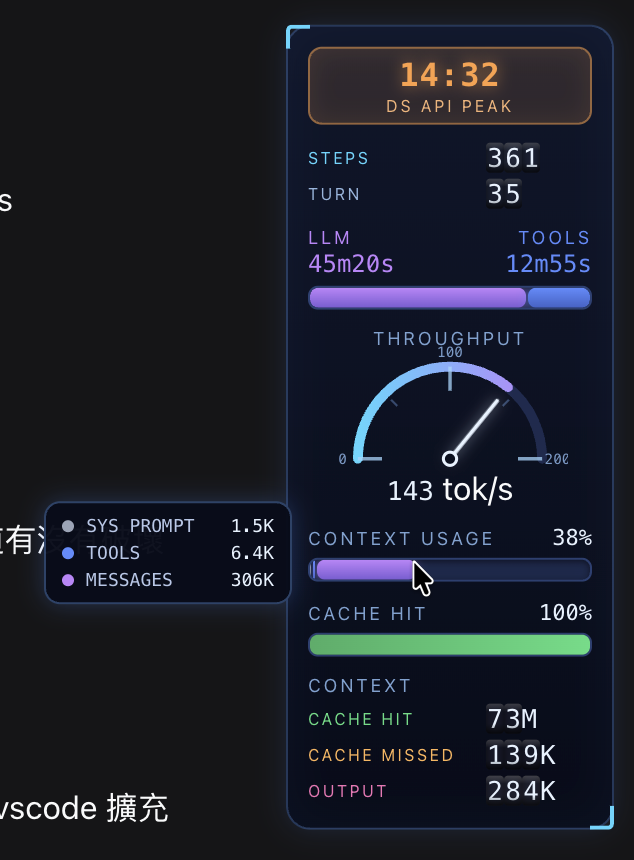
Context-window usage % with 3 segments: Sys Prompt (gray) / Tools (blue) / Messages (purple) by token ratio | 0-100% | ≥80% whole bar turns solid red; hover shows the three token counts |
CACHE HIT bar |
Cache-hit % | 0-100% | <50% red, <80% yellow, ≥80% green |
CONTEXT rolling counter |
Three odometer rows: CACHE HIT (green) / CACHE MISSED (orange) / OUTPUT (pink) | Drums spin up from 0 on mount; digits roll up on increase (carry 9→0), down on decrease | — |
While the agent is running the whole panel breathes and bars pulse.
Hovering the CONTEXT USAGE bar pops up a tooltip with the token breakdown:
Responsive layout
The HUD adapts to the free space right of the chat column (measured live with a ResizeObserver, so sidebar drags, the details drawer and window resizes all count):
| Tier | Condition | Shows |
|---|---|---|
full |
Window ≥ 800px and free space ≥ 180px | Everything |
mini |
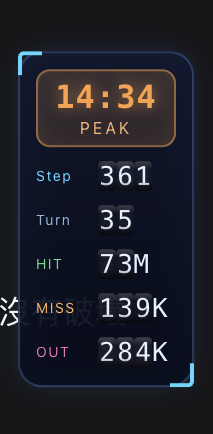
Window ≥ 800px and free space < 180px | Clock (short PEAK/OFF PEAK badge) + compact rolling rows (Step/Turn/HIT/MISS/OUT) |
hidden |
Window < 800px | Nothing (element stays mounted, display:none) |
The window width is a hard floor: below 800px the panel hides even with room to spare, and only the measured space decides full vs mini (the full panel needs 164px + 12px margin). mini may slightly overlap the chat on narrow windows — safe because the panel is click-through. If the chat column can't be measured, the panel falls back to full.
The mini tier in a narrow window:
Requirements
- DeepSeek Harness
dsh(tested on 0.1.0-rc.6, macOS) - pnpm (for plugin management)
Install
# from a local checkout
dsh plugin --profile web add /path/to/dsh-stats-hud

# or straight from GitHub
dsh plugin --profile web add https://github.com/lauytgary/dsh_hud_plugin
Then restart dsh web (loader entries are scanned at boot) and refresh the page. The package is installed as a link: dependency — after editing lib/client.js locally, only a restart is needed, no reinstall.
The plugin then shows up in Settings → Plugins:
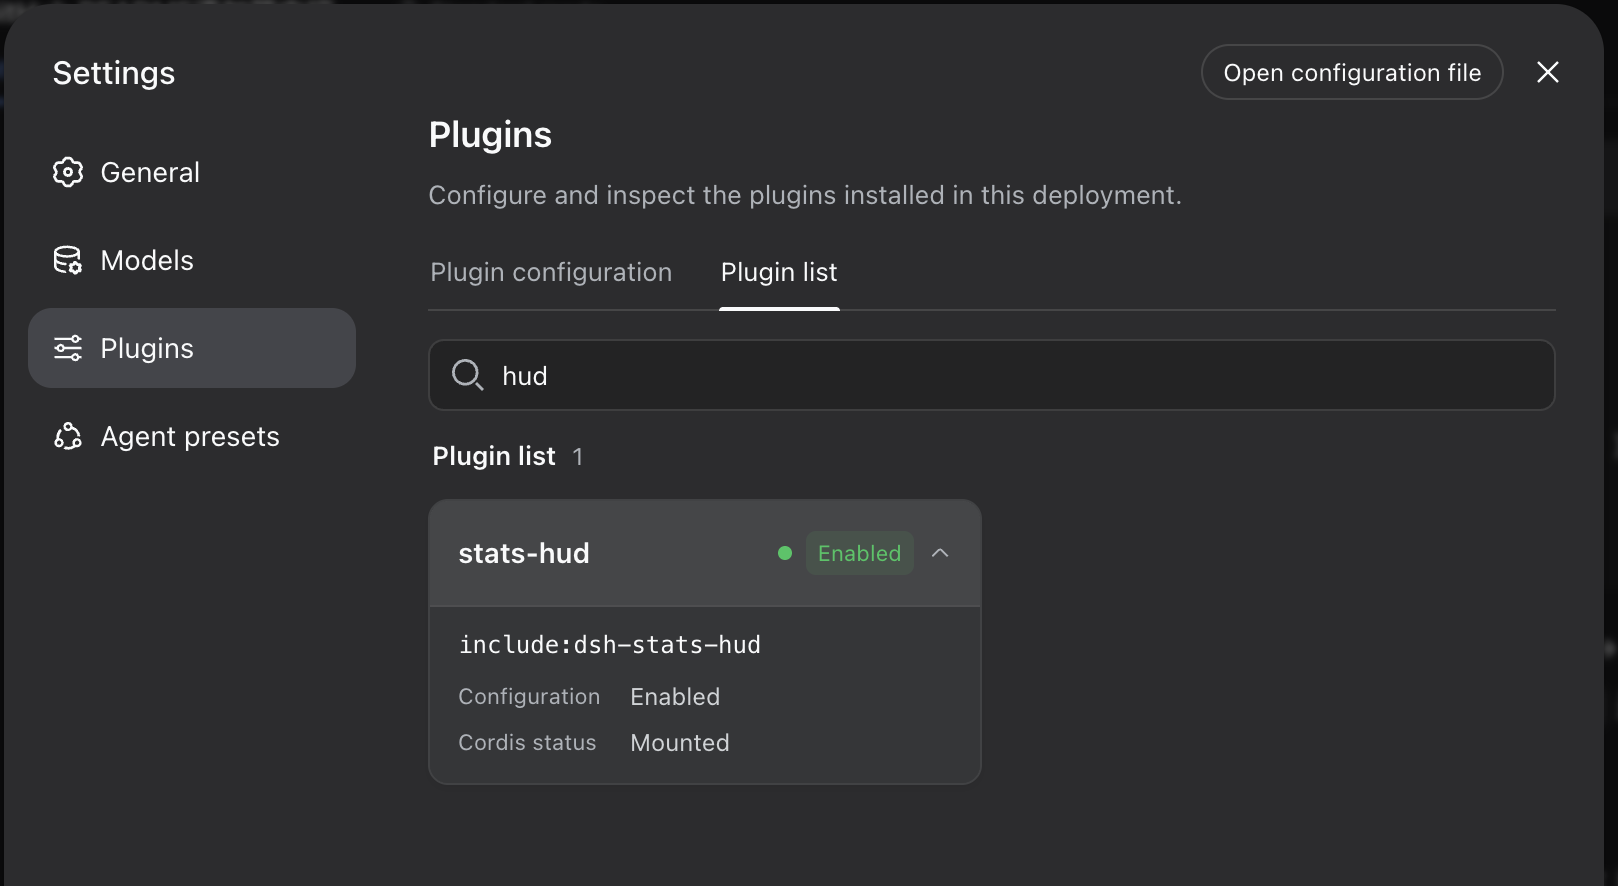
Uninstall
dsh plugin --profile web remove dsh-stats-hud
How it works
- Registers into the
conversation.composer.dockslot (iddsh-stats-hud, order 1) — only to receive the session-scoped hooks (useSession/useProjection); the panel itself isposition: fixed, takes no layout space, and the stock stats line stays untouched. - Data comes from the same projections the stock UI uses:
useProjection("sessionStats"),useProjection("tokenUsage"),useProjection("contextPressure")anduseProjection("contextBreakdown")— zero host-side changes. exports.inject = ["slots"]is mandatory: DSH's ctx is a strict proxy, and accessing an undeclared service throws (cannot get property "locale" without inject).- The panel is
pointer-events: none(click-through); only the CONTEXT USAGE bar re-enables pointer events so its hover tooltip works.
Files
dsh-stats-hud/
├── package.json          # dsh.bundle (patch layer) + dsh.client (browser entry)
├── cordis.patch.yml      # inserts the plugin into loader entries
├── lib/
│   ├── index.js          # host-side no-op (pure browser plugin)
│   └── client.js         # browser bundle: HUD components + slot registration
└── test/
    └── format.test.js    # pure-function unit tests (node:test, zero deps)
lib/client.js is a hand-written loader bundle (window.__ModuleLoader__.load) — no build step needed.
Development & testing
npm test # pure-function unit tests (node:test, no dependencies; Node ≥ 18)
The tests load lib/client.js in a Node VM with a stubbed loader (no DOM
needed) and exercise the pure helpers — formatTokens, formatDuration,
formatTps, tierOf, billedInputTokens, cacheHitPercent. The test-only
__test export is gated behind the DSH_HUD_TEST env var, so the browser
bundle is unaffected.
Tuning
All constants live in lib/client.js:
- Labels: the
Lobject (all-English LLM terminology) - Peak hours:
LocalClockdelegates toisDsApiPeak(date), which checks the Beijing (UTC+8) weekdaybjDow >= 1 && bjDow <= 5(Mon-Fri) together withbjMin >= 540 && bjMin < 720(9-12h) />= 840 && < 1080(14-18h), wherebjMin/bjDowcome fromnew Date(date.getTime() + 8*3600e3)— weekends are always off-peak MissionRolling: rolling drums for steps/turns (no full scale)ChannelBar: segment ratio =llmMs / (llmMs + toolMs)(no cap)SpeedGauge'sredline = 200(initial; auto-scales in 100 tok/s steps)ContextUsageBar: segment colors and the ≥80% solid-red threshold; the hover tooltip readssystemTokens/toolsTokens/messageTokensfrom thecontextBreakdownprojection- Rolling counter:
DRUM(3× 0-9),DRUM_H = 15(px per digit),RollingValue's carry/borrow formula and mount spin-up - CSS:
position:fixed; right:12px; tiers intierOf(space, width)—width < 800→hidden(window-width floor),space >= 180→full, elsemini(measurement failure falls back tofull) — plus the.gsh-root.gsh-*rules;@media (prefers-reduced-motion: reduce)disables pulses and transitions
Publishing to npm (optional)
# remove "private": true from package.json, then
npm publish
# users install with:
dsh plugin --profile web add dsh-stats-hud
Contact
Questions, ideas or issues? Open a discussion on GitHub:
License
MIT
相关推荐Related
-
 nexu-io/open-design
🎨 Best DeepSeek Harness Design Plugin. The open-source Claude Design alternative. 🖥️ Local-first desktop app. 🖼️ Your…
nexu-io/open-design
🎨 Best DeepSeek Harness Design Plugin. The open-source Claude Design alternative. 🖥️ Local-first desktop app. 🖼️ Your…
-
 freestylefly/awesome-gpt-image-2
Prompt as Code | GPT-Image2 工业级提示词引擎与模板库,530+ 个案例逆向工程,20+ 套工业级模板,并提炼出Skills,持续更新中
freestylefly/awesome-gpt-image-2
Prompt as Code | GPT-Image2 工业级提示词引擎与模板库,530+ 个案例逆向工程,20+ 套工业级模板,并提炼出Skills,持续更新中
-
 anywhere-labs/dsh-desktop
为 DeepSeek Harness (DSH) 插件生态打造的现代化桌面端解决方案。万物皆「插件」,桌面本身也是「插件」。
anywhere-labs/dsh-desktop
为 DeepSeek Harness (DSH) 插件生态打造的现代化桌面端解决方案。万物皆「插件」,桌面本身也是「插件」。
- Nagi-ovo/voyager Enhancement suite for Gemini, AI Studio, Claude & ChatGPT — plus a prompt manager for any web UI, DeepSeek Harness inclu…
-
 walkinglabs/learn-harness-engineering
Harness engineering beginner tutorial, from 0 to 1
walkinglabs/learn-harness-engineering
Harness engineering beginner tutorial, from 0 to 1
-
 awesome-dsh-plugin/awesome-dsh-plugin
A curated list of plugins for DeepSeek Harness (dsh) · DeepSeek Harness 插件精选列表
awesome-dsh-plugin/awesome-dsh-plugin
A curated list of plugins for DeepSeek Harness (dsh) · DeepSeek Harness 插件精选列表
-
 MemTensor/MemOS
Self-evolving memory OS for LLM & AI Agents: ultra-persistent memory, hybrid-retrieval, and cross-task skill reuse, with…
MemTensor/MemOS
Self-evolving memory OS for LLM & AI Agents: ultra-persistent memory, hybrid-retrieval, and cross-task skill reuse, with…
- yjh051108/dsh-routing-suite dsh-routing-suite — injector + router-standard kit: install the runtime injector first, then the task-aware reasoning-mo…