Max-Samson/dsh-usage-chart
一个用于实时Token用量、成本估算、每轮图表和DeepSeek API余额的DeepSeek Harness Web插件。
Project Overview项目介绍
This is a DSH-native plugin that adds a usage, cost, and account balance dashboard for DeepSeek Harness Web. The plugin inserts a compact indicator bar just below the conversation composer, which displays input/output token counts, cache hit ratio, estimated cost, active model, and a multi-segment context pressure bar. Users can click this indicator to open a full zero-dependency SVG dashboard that shows detailed per-turn usage history across an entire session. It is compatible with DSH version 0.1.0-rc.6 and newer, and adapts to the official DSH session snapshot API for older and newer DSH builds.
It comes with a wide range of features tailored for DeepSeek API cost tracking, including per-round cost breakdowns, duration overlays, cost anomaly markers, context compaction diagnostics, peak/off-peak tiered billing, and official dual-currency pricing. It supports one-click toggling between USD and CNY display, and this preference is persisted in the browser’s localStorage. The entire interface automatically matches the active DSH theme (light/dark) and language setting (English/Chinese) with no extra configuration required from the user. This consistent integration makes it easy to use alongside your existing DSH workflow without disrupting your existing layout or preferences.
The plugin follows strict data and security boundaries, pulling all token and context data directly from the active DSH session, and never exposes the user’s DeepSeek API key to the browser or external services. It requires Node.js 20 or newer to build, and has no native binary dependencies, so it runs on all major operating systems including macOS, Linux, and Windows. It is released under the open source MIT license, so users can modify it or override built-in pricing via a custom pricing.json file if they need to accommodate custom or updated model pricing.
这是一个专为DeepSeek Harness打造的原生插件,为DSH Web提供DeepSeek API用量、成本和账户余额的可视化分析仪表盘。插件会在对话输入框下方添加一个紧凑指示器,展示输入输出Token、缓存命中率、估算成本、当前激活模型以及多分段上下文压力条。点击指示器即可打开零依赖SVG仪表盘,查看每轮对话的完整使用历史。
仪表盘支持多种功能,包括按轮统计的成本视图、时长覆盖层、成本异常标记、上下文压缩诊断、高低峰时段分级计费和官方双币种定价显示。它还支持在美元和人民币之间一键切换,设置会保存在浏览器本地存储中,整体界面会自动适配DSH的系统主题和语言设置。
插件兼容DSH 0.1.0-rc.6及以上版本,适配不同DSH版本的会话事件API,支持Node.js 20以上版本,无原生依赖,可在全平台运行。它遵循严格的数据安全边界,所有数据仅来自DSH会话,不会向外部泄露API密钥,采用MIT许可完全开源免费。
请帮我安装这个 DSH 插件。安装前先完成【兼容性检查 + 安全性检查】,检查通过再动手。

插件:dsh-usage-chart(Max-Samson/dsh-usage-chart)
仓库:https://github.com/Max-Samson/dsh-usage-chart
本站详情页:https://www.yhbd.top/plugins/max-samson-dsh-usage-chart/
本站登记:类型 plugin · 归类 原生 DSH 插件 · 许可证 MIT · ⭐ 9 · 最近提交 2026-09-23 · 主语言 TypeScript

按下面顺序执行,每步先把结论告诉我,再进入下一步:

【1 兼容性检查】
① 我这边:DSH 版本、Node 版本、操作系统、当前 profile(web / desktop)。
② 读它的 README、package.json、插件 manifest,列出它要求的 DSH 版本 / Node 版本 / 操作系统 / 外部依赖 / 需要另外先装的运行时。
③ 逐条比对,结论只写「满足 / 不满足 / 未知」三种;不满足的给出可行替代方案。
④ 检查是否和我已装的插件冲突:命令名重复、skill / tool 重名、端口占用、重复注册的 MCP server。

【2 安全性检查】
① 仓库可信度:和上面「本站登记」是否一致;star / fork 数、创建时间、最近提交,是否归档或长期停更。
② 安装脚本:逐行看 package.json 的 preinstall / install / postinstall,以及 install.sh、setup.ps1 之类脚本。出现 curl|bash、下载后直接执行、混淆代码、访问与插件功能无关的域名,立刻停下来告诉我,不要继续装。
③ 依赖:列出新增依赖,标出无人维护、或与知名包拼写近似的可疑包(typosquatting)。
④ 权限与副作用:它会读写哪些目录、访问哪些域名、需要哪些 DSH 权限(filesystem / network / shell / clipboard 等),以及怎么卸载和回滚。
⑤ 如果它要求 sudo / 管理员权限,或权限明显超出功能所需,先停下来问我。

【3 安装】
上面两步没有「不满足」和「高危项」时才执行;用官方推荐方式安装,不要自行提权。

【4 汇报】
用表格输出:检查项 / 结论 / 依据 / 是否需要我决策。拿不准的一律写「未知」并说明要我怎么确认——不要猜,也不要替我决定。
Send this message to DSH in your current session: it verifies compatibility and security first (answering met / not met / unknown item by item) and only installs once everything checks out — it will stop and ask you if it finds a high-risk item. The box scrolls; the copy is the full prompt. CLI install commands may not be accurate across systems, so DSH is the safer route.把上面这条消息直接发给当前会话里的 DSH:它会先核对兼容性与安全性(逐条给「满足 / 不满足 / 未知」),确认没问题再安装,有高危项会停下来问你。框内可滚动,复制到的是完整提示词;安装命令不一定准确,发给 DSH 更稳。
- Only 9 stars - very few users, little community feedback星标只有 9,几乎没人在用,遇到问题缺少社区反馈
DSH walks through these 9 checksDSH 会逐条核对这 9 项
Compatibility兼容性
- DSH, Node, OS and profile requirementsDSH 版本 / Node 版本 / 操作系统 / profile 是否满足要求
- External dependencies and runtimes (Electron / Python / Docker, ...)外部依赖与运行时(Electron / Python / Docker 等)是否齐备
- Conflicts with installed plugins: command names, skill / tool names, ports, duplicate MCP registration与已装插件是否冲突:命令名、skill / tool 重名、端口占用、重复 MCP 注册
Security安全性
- Repo matches the facts registered here; archived or abandoned?仓库是否与页面登记一致,是否归档或长期停更
- Safety of preinstall / install / postinstall and install.sh / setup.ps1preinstall / install / postinstall 与 install.sh、setup.ps1 是否安全
- curl|bash, download-then-execute, obfuscation, unrelated domains → stop immediatelycurl|bash、下载即执行、混淆代码、无关域名 → 立刻停止
- Typosquatting or unmaintained packages among the new dependencies新增依赖里有没有 typosquatting 或无人维护的包
- Requested permissions vs. what the feature actually needs申请了哪些权限、是否超出功能所需(filesystem / network / shell / clipboard)
- Any sudo / admin requirement, plus uninstall and rollback是否要求 sudo / 管理员权限,以及卸载与回滚方式
Anything uncertain must be marked unknown with a note on how to confirm it. This site's signal screen is a static snapshot, not a security audit.拿不准的必须标「未知」并说明要我怎么确认。本站的信号筛查是静态快照,不能替代安全审计。
Or use CLI install (for developers)或使用命令行安装(适合开发者)
CLI Install命令行安装
dsh plugin --profile web add dsh-usage-chart把 Max-Samson/dsh-usage-chart 加入你的 DSH 配置(web profile)即可启用。
READMEREADME
dsh-usage-chart
A usage, cost, and account-balance dashboard for DeepSeek Harness Web.


简体中文 · Report an issue · Changelog (EN) · 更新日志(中文)
Interface preview: light English on the left and dark Simplified Chinese on the right. Both variants follow the DSH theme and in-app language setting.
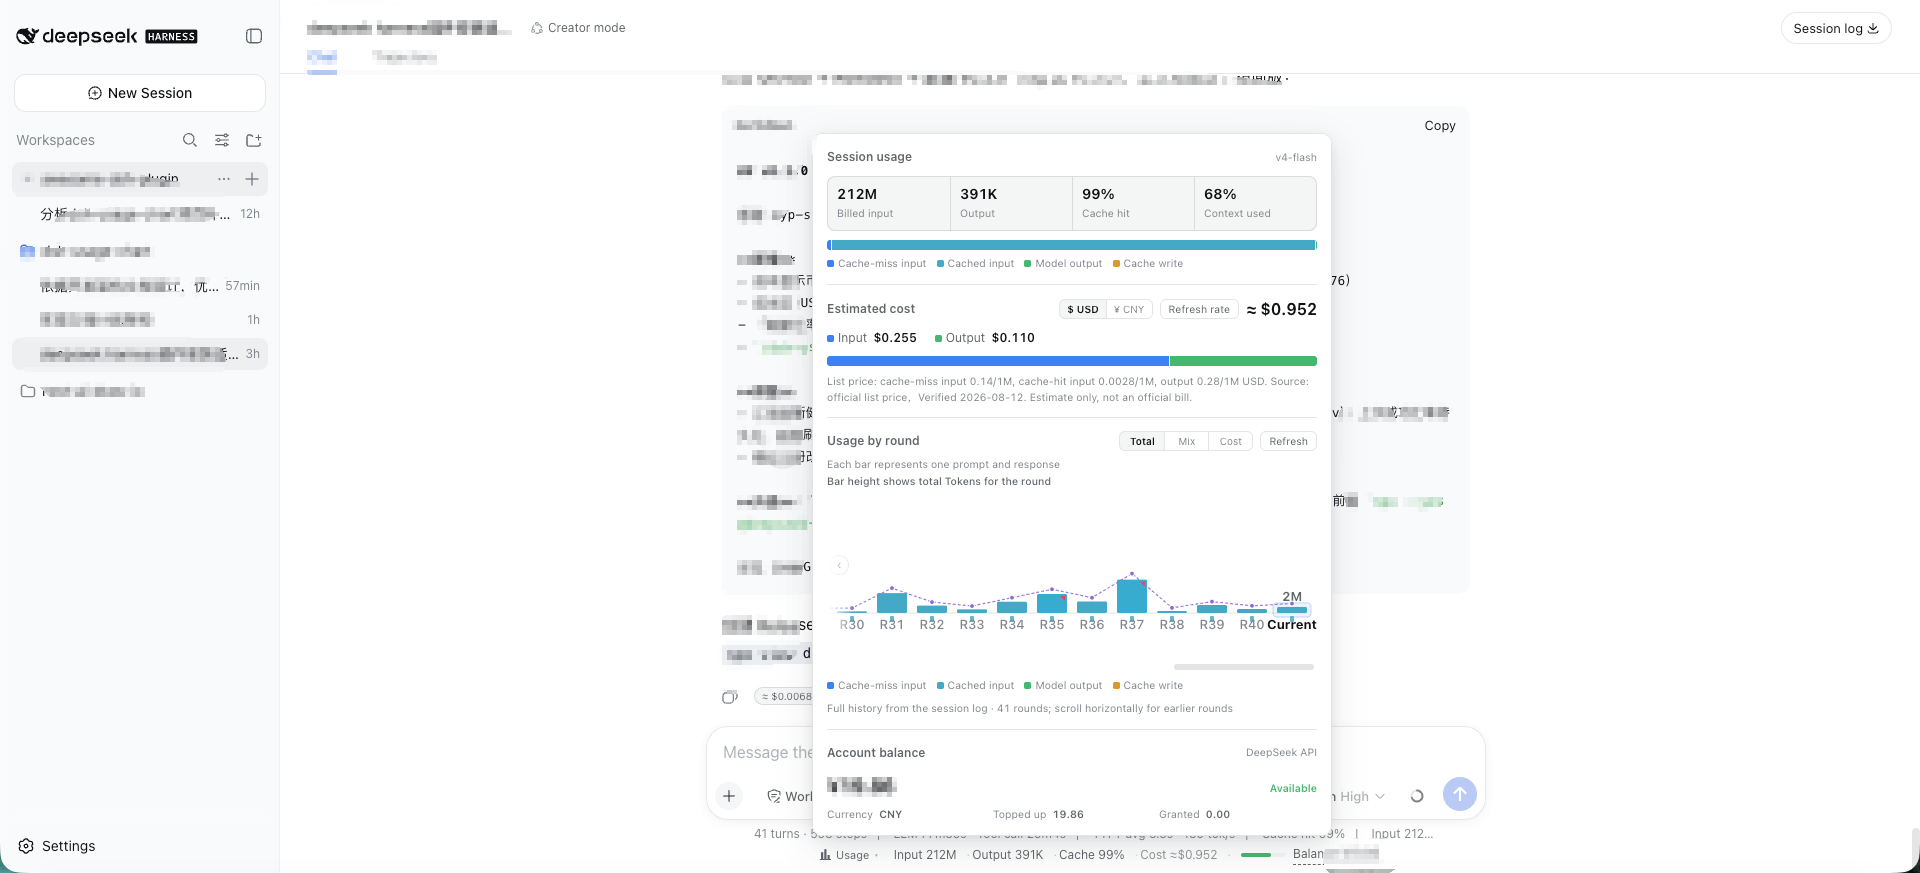 Light theme · English |
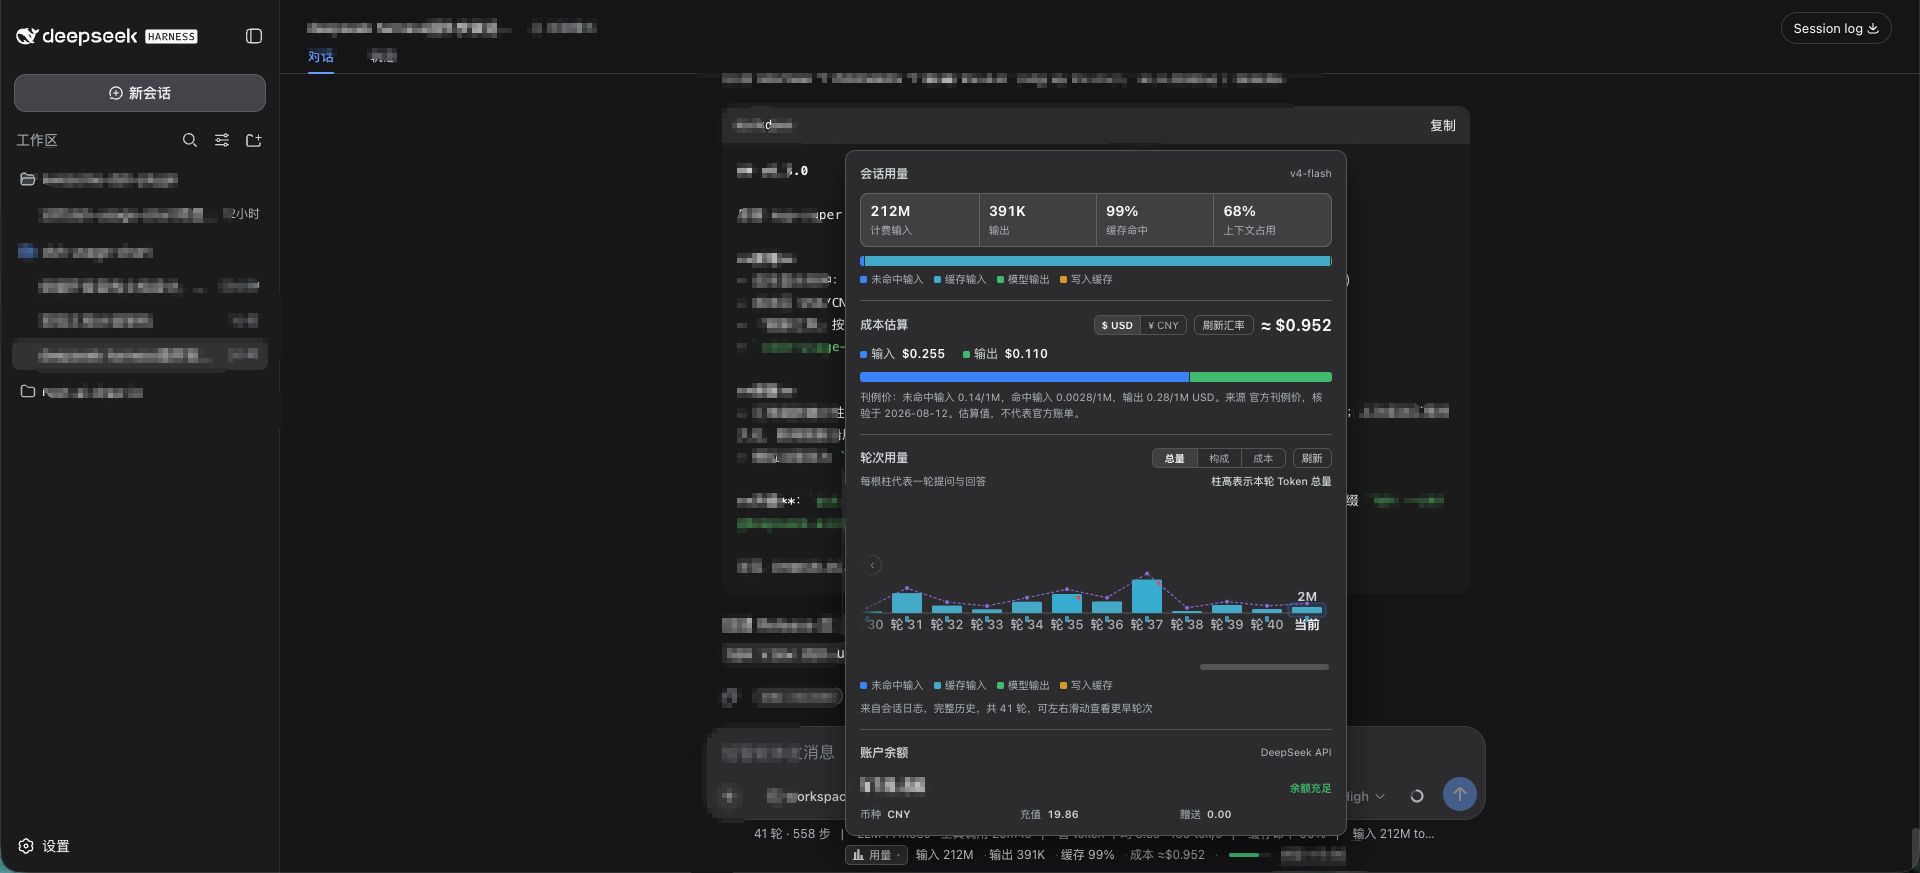 Dark theme · 简体中文 |
Both screenshots use fictional demo data only. They contain no real session content, token counts, costs, balances, or API keys.
The plugin adds a compact indicator below the conversation composer. It shows input/output tokens, cache-hit ratio, estimated cost, active model, a multi-segment context-pressure bar (system/tools/messages breakdown, v1.1.0), and DeepSeek account balance. Click it to open a zero-dependency SVG dashboard with per-turn usage history — including a cost view (every bar shows its own cost value, not just the current round), a duration overlay, anomaly markers, an explainer tooltip (tokens + cost + model + billing tier + duration/TTFT/TPS + user input source attribution: human/agent/continuation, v1.1.0 + end reason), horizontally scrollable per-round bars (all rounds, fixed slim bar width, auto-scroll to latest), a dedicated Context & Compaction Diagnostics section (system/tools/messages token composition, compaction timeline, freed tokens, summarize cost, context occupancy suggestions, v1.1.0), a dismissible ≈ ¥/$0.00xx badge on each assistant message, peak/off-peak tiered billing with a live red/green billing-tier tag in the panel (red = peak, green = off-peak, v1.0.1), and official dual-currency pricing (CNY from the Chinese pricing page, USD from the English pricing page — no FX conversion, v1.0.1).
Showing the opening section of the README — the full document lives in the repository以上为 README 开头摘要,完整文档在仓库内 · View the full README on GitHub →在 GitHub 查看完整 README →
Related相关推荐
-
 FTShare-Lab/dsh_kline
面向 DeepSeek Harness 的交互式 K 线分析插件,支持多市场行情、技术指标、支撑压力位、新闻与基本面分析,并在原生侧栏中直接展示。
FTShare-Lab/dsh_kline
面向 DeepSeek Harness 的交互式 K 线分析插件,支持多市场行情、技术指标、支撑压力位、新闻与基本面分析,并在原生侧栏中直接展示。
- the-beating-light-of-the-nail/awesome-dsh-plugin-stock Curated vertical list of stock/finance/quant plugins for DeepSeek Harness (dsh) — 24 verified entries, bilingual
- Nicholas023/vision-exp-tile DSH 插件:大图切 800×800 无损小块 + 坐标标注 + 分块聚合逻辑,直连 deepseek-v4-flash-vision-exp 识别;仅用纯官方 DSH 功能,零依赖第三方插件,不统计 token/费用。
- 01men/ybkk-AIOS 榕器 · 企业 AI 资源统一管理平台 —— dsh/cordis 插件化(IAM/OIDC/MCP/Skill 市场/Agent/审计/用量计量/模型网关/流程编排/FinOps),按团队+领域资产定价 · 制造业私有化交付项目制,对外只…
-
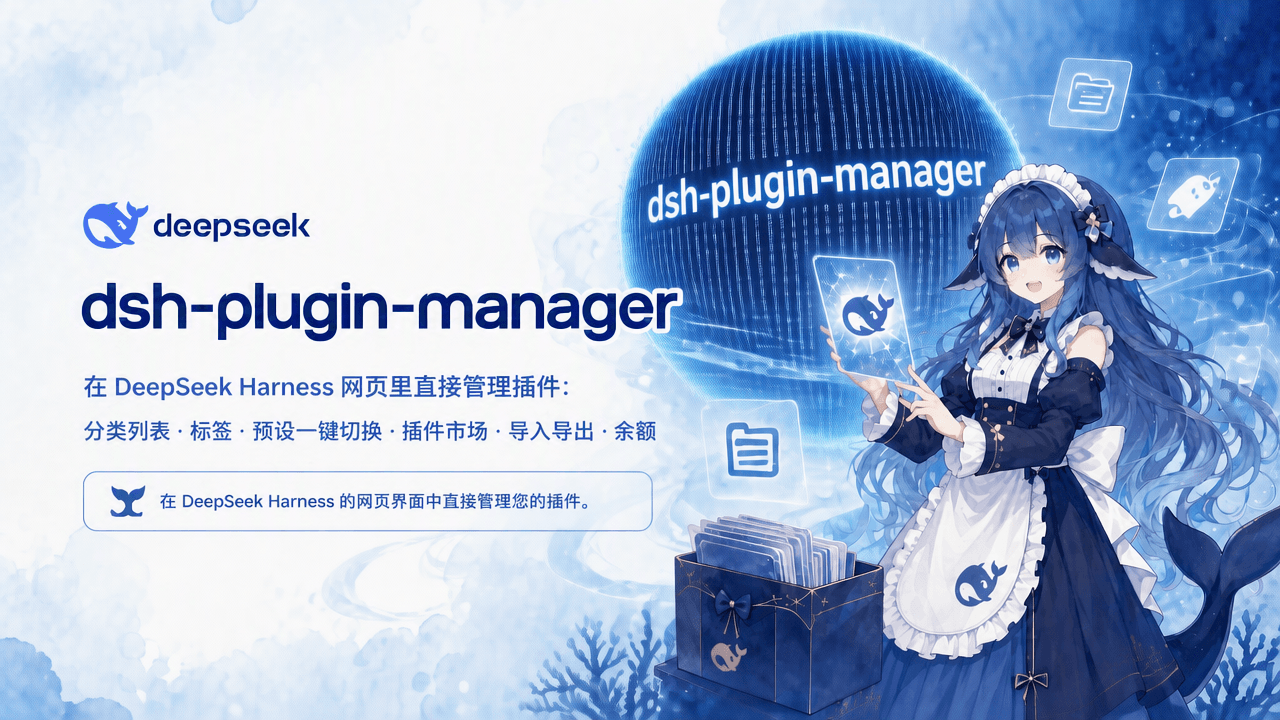 kkkkkklze/dsh-plugin-manager
In-web plugin manager for DeepSeek Harness: categorized list, tags, one-click preset switching, plugin marketplace, impo…
kkkkkklze/dsh-plugin-manager
In-web plugin manager for DeepSeek Harness: categorized list, tags, one-click preset switching, plugin marketplace, impo…
- kobenfang/BigPlan 📋 BigPlan AI产品调研 - 市场/技术/供应链分析,三套产品规格方案 | Product research, market analysis
-
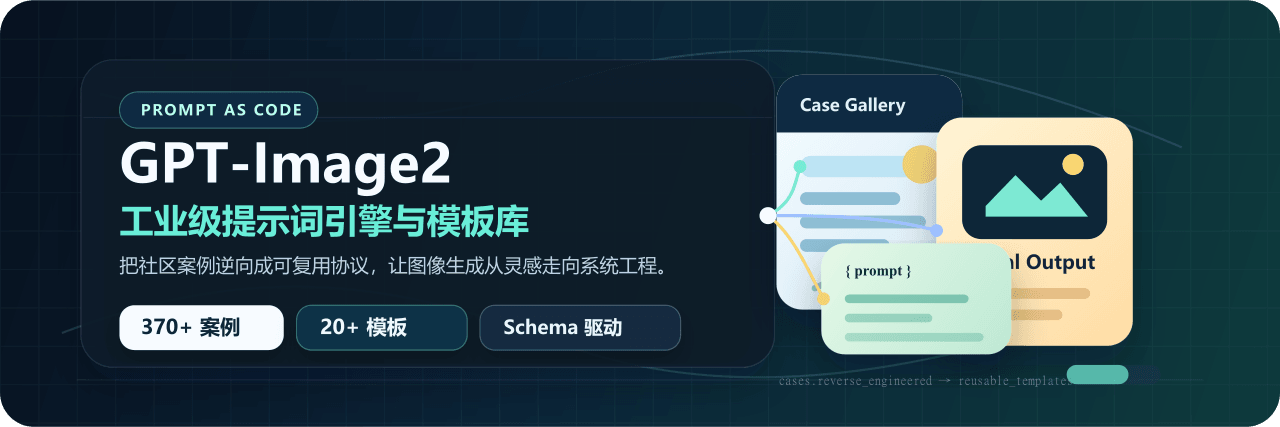 freestylefly/awesome-gpt-image-2
Prompt as Code | GPT Image 2 / 2.5 提示词与案例库,530+ 个案例、20+ 套工业级模板与可复用 Skills,新增 2.5 同提示词对比专区,附完整提示词与生成记录,持续更新。
freestylefly/awesome-gpt-image-2
Prompt as Code | GPT Image 2 / 2.5 提示词与案例库,530+ 个案例、20+ 套工业级模板与可复用 Skills,新增 2.5 同提示词对比专区,附完整提示词与生成记录,持续更新。
-
 awesome-dsh-plugin/awesome-dsh-plugin
A curated list of plugins for DeepSeek Harness (dsh) · DeepSeek Harness 插件精选列表
awesome-dsh-plugin/awesome-dsh-plugin
A curated list of plugins for DeepSeek Harness (dsh) · DeepSeek Harness 插件精选列表