Small-Miao/dsh-statusbar
DSH Web的类VSCode底部状态栏:令牌使用量、CPU/内存字符条、会话统计、实时TPS、逐项配置
Project Overview项目介绍
dsh-statusbar is a DSH plugin that renders a 24px bottom status bar in DeepSeek Harness Web via the shell.overlay seat, reserving frame space so content is never covered. It shows conversation tokens, session turns/steps, LLM and tool wall time, first-token latency, decode throughput, cache hit rate, billed tokens, live TPS (requires dsh-live-stats), CPU, memory, and a host clock, all individually configurable for visibility, alignment, and order. Configuration persists via HTTP endpoints to a JSON file next to the profile. Other host plugins can register custom items or data sources through the statusbar Cordis service. Caveat: the layout selector depends on the web build's hashed frame class and must be updated if the app CSS is rebuilt.
dsh-statusbar 是 DeepSeek Harness Web 的底部状态栏插件,以 24px 高度渲染于 shell.overlay 并为页面预留空间。可显示对话 tokens、会话轮次、LLM/工具耗时、首 token 与吞吐、缓存命中率、计费 tokens、实时 TPS(需 dsh-live-stats),以及 CPU、内存、主机时钟等条目,每项可见性、左右对齐、顺序均可在设置页配置,并通过 GET /dsh-statusbar/snapshot 与 POST /dsh-statusbar/config 持久化。当 web 框架 CSS 哈希变化时需更新 lib/client.js 中的 .pI_x6G_frame 选择器,否则底部空间可能失效。
请帮我了解并安装插件:【dsh-statusbar】【https://github.com/Small-Miao/dsh-statusbar】Send this message to DSH in your current session. CLI install commands may not be accurate across systems — DSH will figure it out for you.把上面这条消息直接发给当前会话里的 DSH,让它帮你了解并安装。安装命令不一定准确,发给 DSH 更稳。
Or use CLI install (for developers)或使用命令行安装(适合开发者)
CLI Install命令行安装
dsh plugin --profile web add https://github.com/Small-Miao/dsh-statusbar把 Small-Miao/dsh-statusbar 加入你的 DSH 配置(web profile)即可启用。
READMEREADME
dsh-statusbar
A VSCode-style bottom status bar for DeepSeek Harness Web. Shows your conversation usage, host CPU/memory, and a live generation rate — every item configurable.



English | 简体中文
Features
- 24px bottom bar rendered via the
shell.overlayseat; the app frame reserves bottom space so the page content (sidebar settings, composer) is never covered. - Built-in items (each individually configurable — see Configuration):
DSHbrand (left)⧉ Tokens— estimated tokens of the current conversation (tokenMeter)7 轮 · 64 步— session turns / steps (sessionStats)LLM 14m12s · 工具调用 48.4s— accumulated LLM / tool wall time首 token 平均 1.3s · 129 tok/s— first-token average + decode throughput缓存命中 97%— prompt-side cache hit rate (tokenUsage)输入 7.4M tok · 输出 98.9K tok— billed input / output tokensTPS 363 tok/s— live generation rate (liveTokenUsage; needs dsh-live-stats)CPU 20% [||||||||||]— Linux-style colored char bar (green → yellow → red)MEM 55% (8.2G/14.8G) [||||||||||]— memory usage with char bar- Host clock
- Hides the original stats line + TPS row under the composer input box (now redundant).
- Polls
/dsh-statusbar/snapshot?session=<id>every 2 s.
Installation
Prerequisites: a DSH install with a web profile (e.g. the default web profile created by
dsh web).
# from the GitHub repository
dsh plugin --profile web add https://github.com/Small-Miao/dsh-statusbar

# or via SSH (needs GitHub SSH access on this machine)
dsh plugin --profile web add git@github.com:Small-Miao/dsh-statusbar.git

# or from a local checkout (development)
dsh plugin --profile web add /path/to/dsh-statusbar
The command runs pnpm add in the profile, installs the bundle into
~/.dsh/profiles/web/node_modules, and appends the plugin to dsh.profile.bundles.
Then restart DSH; the plugin mounts at startup and the bar appears after a page
refresh.
Manual install (no
dsh plugin):pnpm --dir ~/.dsh/profiles/web add <path-or-url>works too — the plugin is a standarddsh.bundlepackage.
Configuration
Settings → 状态栏: toggle each item's visibility, side (left / right), and order (number input, ascending = further left), plus a "全部重置" (reset all) button.
Config is stored host-side and persisted to dsh-statusbar-config.json next to the
profile composition. HTTP: GET /dsh-statusbar/snapshot?session=<id> returns
{ items, catalog, config }; POST /dsh-statusbar/config accepts { id, patch }
(patch = { visible?, align?, order? }, or null to clear) or { resetAll: true }.
Public API for other plugins
The host exposes a statusbar Cordis service. Other host plugins can add their own
items — including live text and char progress bars:
export function apply(ctx) {
  const statusbar = ctx.get('statusbar')
  if (statusbar === undefined) return   // plugin not installed — degrade gracefully
  ctx.effect(() => statusbar.registerItem({
    id: 'my.item',          // required, unique
    order: 15,              // sort order, ascending (configurable by the user)
    align: 'right',         // 'left' | 'right'
    label: () => 'value',   // string or lazy thunk
    style: 'bar',           // 'text' (default) | 'bar'
    progress: () => 62,     // 0-100, number or lazy thunk (bar style)
    barChar: '|',           // optional, default '|'
    barTotal: 10,           // optional, default 10
    color: '#4fc1ff',       // optional label color
    tooltip: 'hint',        // optional hover text
  }))
  // also: statusbar.updateItem(id, patch) / statusbar.removeItem(id) / statusbar.list()
}
Registering a data source
For plugins that own a live value (their own metric, service readout, projection...),
registerDataSource lets the status bar pull from a provide() callback on its own
refresh cadence and render it as an item (text or char bar):
export function apply(ctx) {
  const statusbar = ctx.get('statusbar')
  if (statusbar === undefined) return
  ctx.effect(() => statusbar.registerDataSource({
    id: 'disk.usage',       // required, unique — also the config key
    order: 55,              // default position
    align: 'right',         // 'left' | 'right'
    style: 'bar',           // 'text' (default) | 'bar'
    barChar: '|',           // optional, default '|'
    barTotal: 10,           // optional, default 10
    refreshMs: 5000,        // optional, default 2000 — host re-calls provide() when stale
    tooltip: '磁盘用量',
    provide: async () => ({ // required — called by the host; return the latest value
      text: '磁盘 62%',
      progress: 62,         // 0-100, used when style is 'bar'
      color: '#4fc1ff',     // optional
      tooltip: 'updated hint', // optional, overrides the default tooltip
    }),
  }))
  // also: statusbar.removeDataSource(id)
}
Data sources appear in the bar and in Settings → 状态栏 exactly like built-in items
(users can toggle/position them), and the host renders the last known value while a
slow provide() is in flight.
Development
git clone https://github.com/Small-Miao/dsh-statusbar
dsh plugin --profile web add ./dsh-statusbar   # or symlink into the profile
lib/index.js— host half:statusbarservice,/dsh-statusbar/*HTTP routes,node:osCPU/memory sampling, session projections (sessionStats/tokenUsage/liveTokenUsage) cached 4 s per session.lib/client.js— browser half (__ModuleLoader__bundle): the bar inshell.overlayand the settings section insettings.section.
Layout note
The reserved bottom space relies on the app frame's hashed class (.pI_x6G_frame in the
current web build). If the web app is rebuilt with new CSS hashes, update that selector in
lib/client.js.
License
Related相关推荐
-
 vshulcz/deja-vu
One memory shared by Claude Code, Codex, Cursor, Copilot CLI, OpenClaw and 20 more coding agents, built from the session…
vshulcz/deja-vu
One memory shared by Claude Code, Codex, Cursor, Copilot CLI, OpenClaw and 20 more coding agents, built from the session…
-
 mnemon-dev/mnemon
LLM-supervised persistent memory for AI agents — graph-based recall, cross-session knowledge, single binary. Works with …
mnemon-dev/mnemon
LLM-supervised persistent memory for AI agents — graph-based recall, cross-session knowledge, single binary. Works with …
-
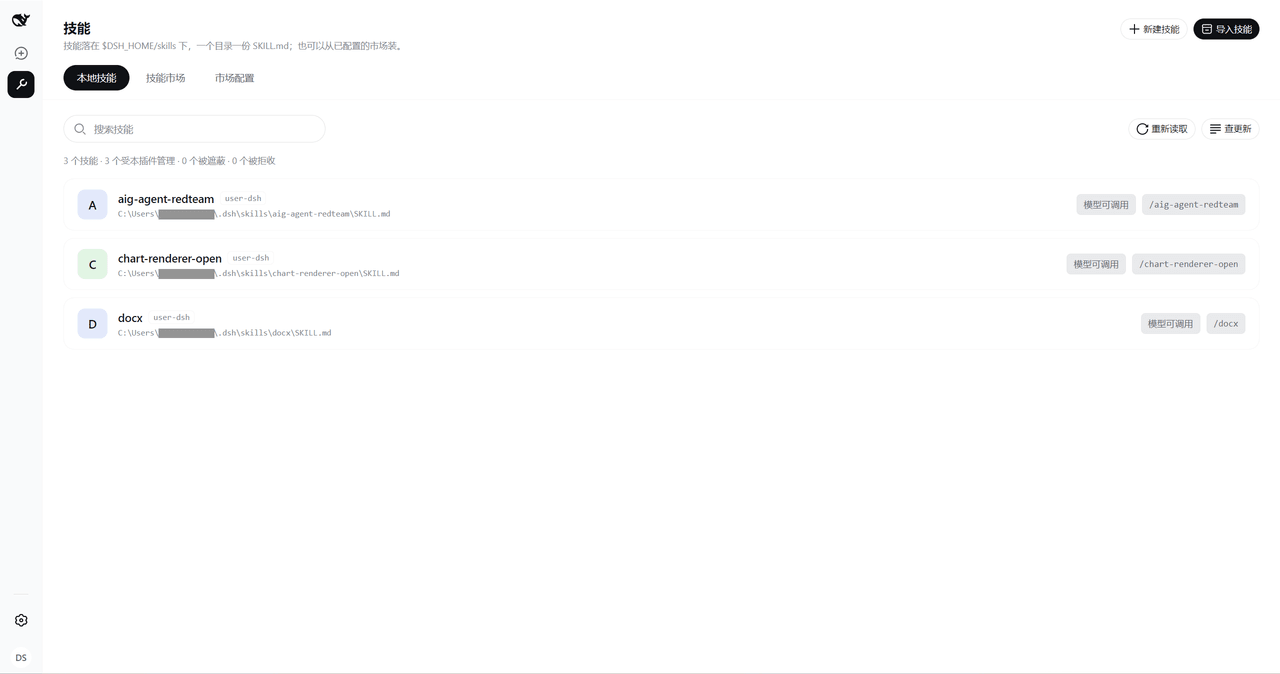 staff-os/dsh-workbench
An enterprise workbench for the DeepSeek Harness: AI employees, knowledge bases, skills, MCP servers and DSH plugins, al…
staff-os/dsh-workbench
An enterprise workbench for the DeepSeek Harness: AI employees, knowledge bases, skills, MCP servers and DSH plugins, al…
- findshan/dsh-agent-memory Self-evolving memory for DeepSeek Harness: capture → dream consolidation → retrieval injection → evolve. User profile, p…
- starfishwrx/dsh-git-memory Git-backed, reviewable long-term context for DeepSeek Harness.
-
 adoresever/graph-memory
Deepseek Harness、Openclaw知识图谱记忆插件。2026年4月受邀发布在清华大学讨论会。Knowledge Graph + Memory;Knowledge Graph Context Engine for OpenCl…
adoresever/graph-memory
Deepseek Harness、Openclaw知识图谱记忆插件。2026年4月受邀发布在清华大学讨论会。Knowledge Graph + Memory;Knowledge Graph Context Engine for OpenCl…
-
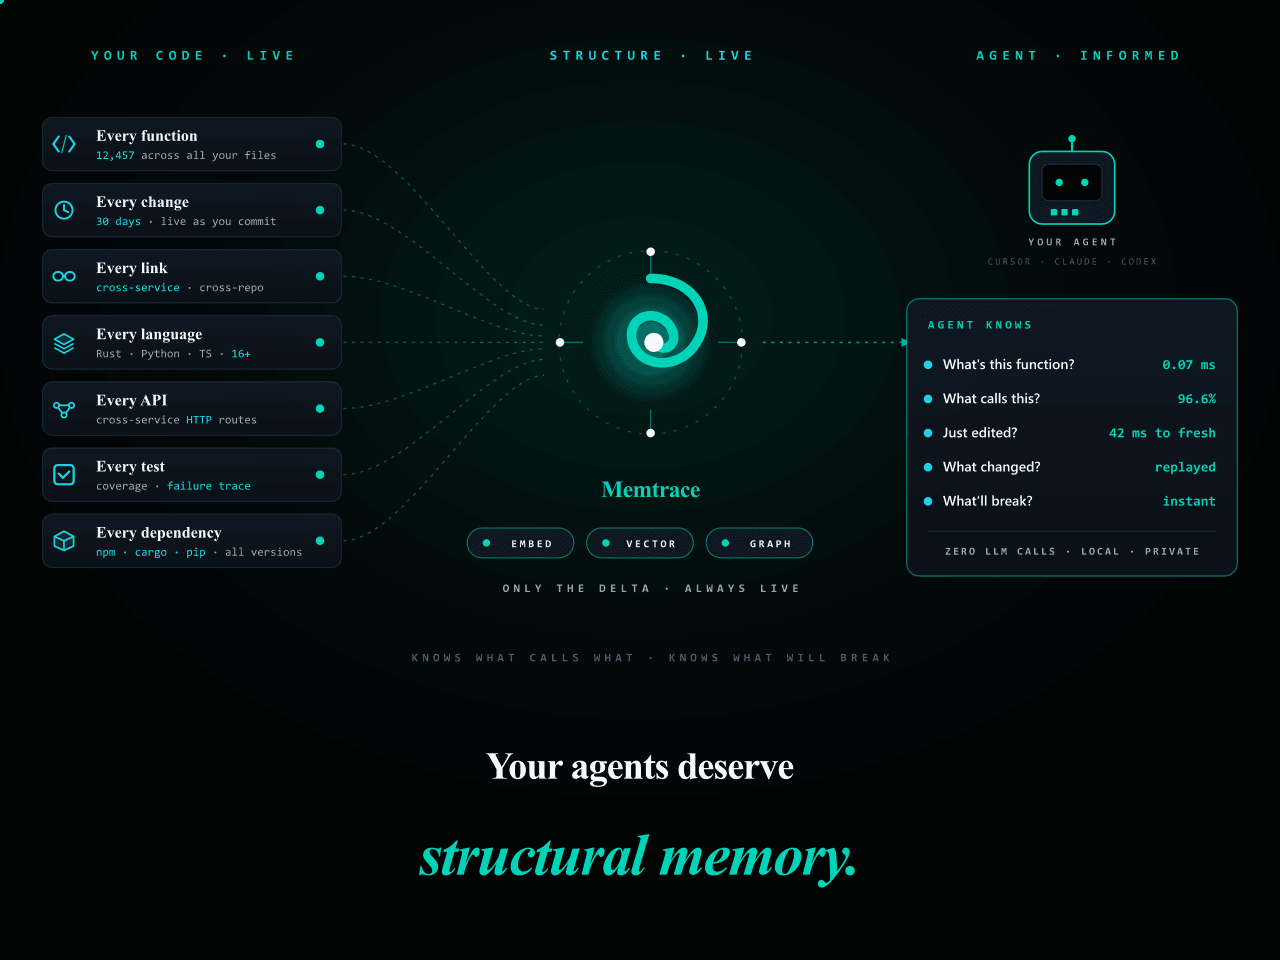 syncable-dev/memtrace-public
Structural memory for AI coding agents. Bi-temporal graph, MCP-native, zero LLM calls. Cursor · Claude Code · Codex · De…
syncable-dev/memtrace-public
Structural memory for AI coding agents. Bi-temporal graph, MCP-native, zero LLM calls. Cursor · Claude Code · Codex · De…
-
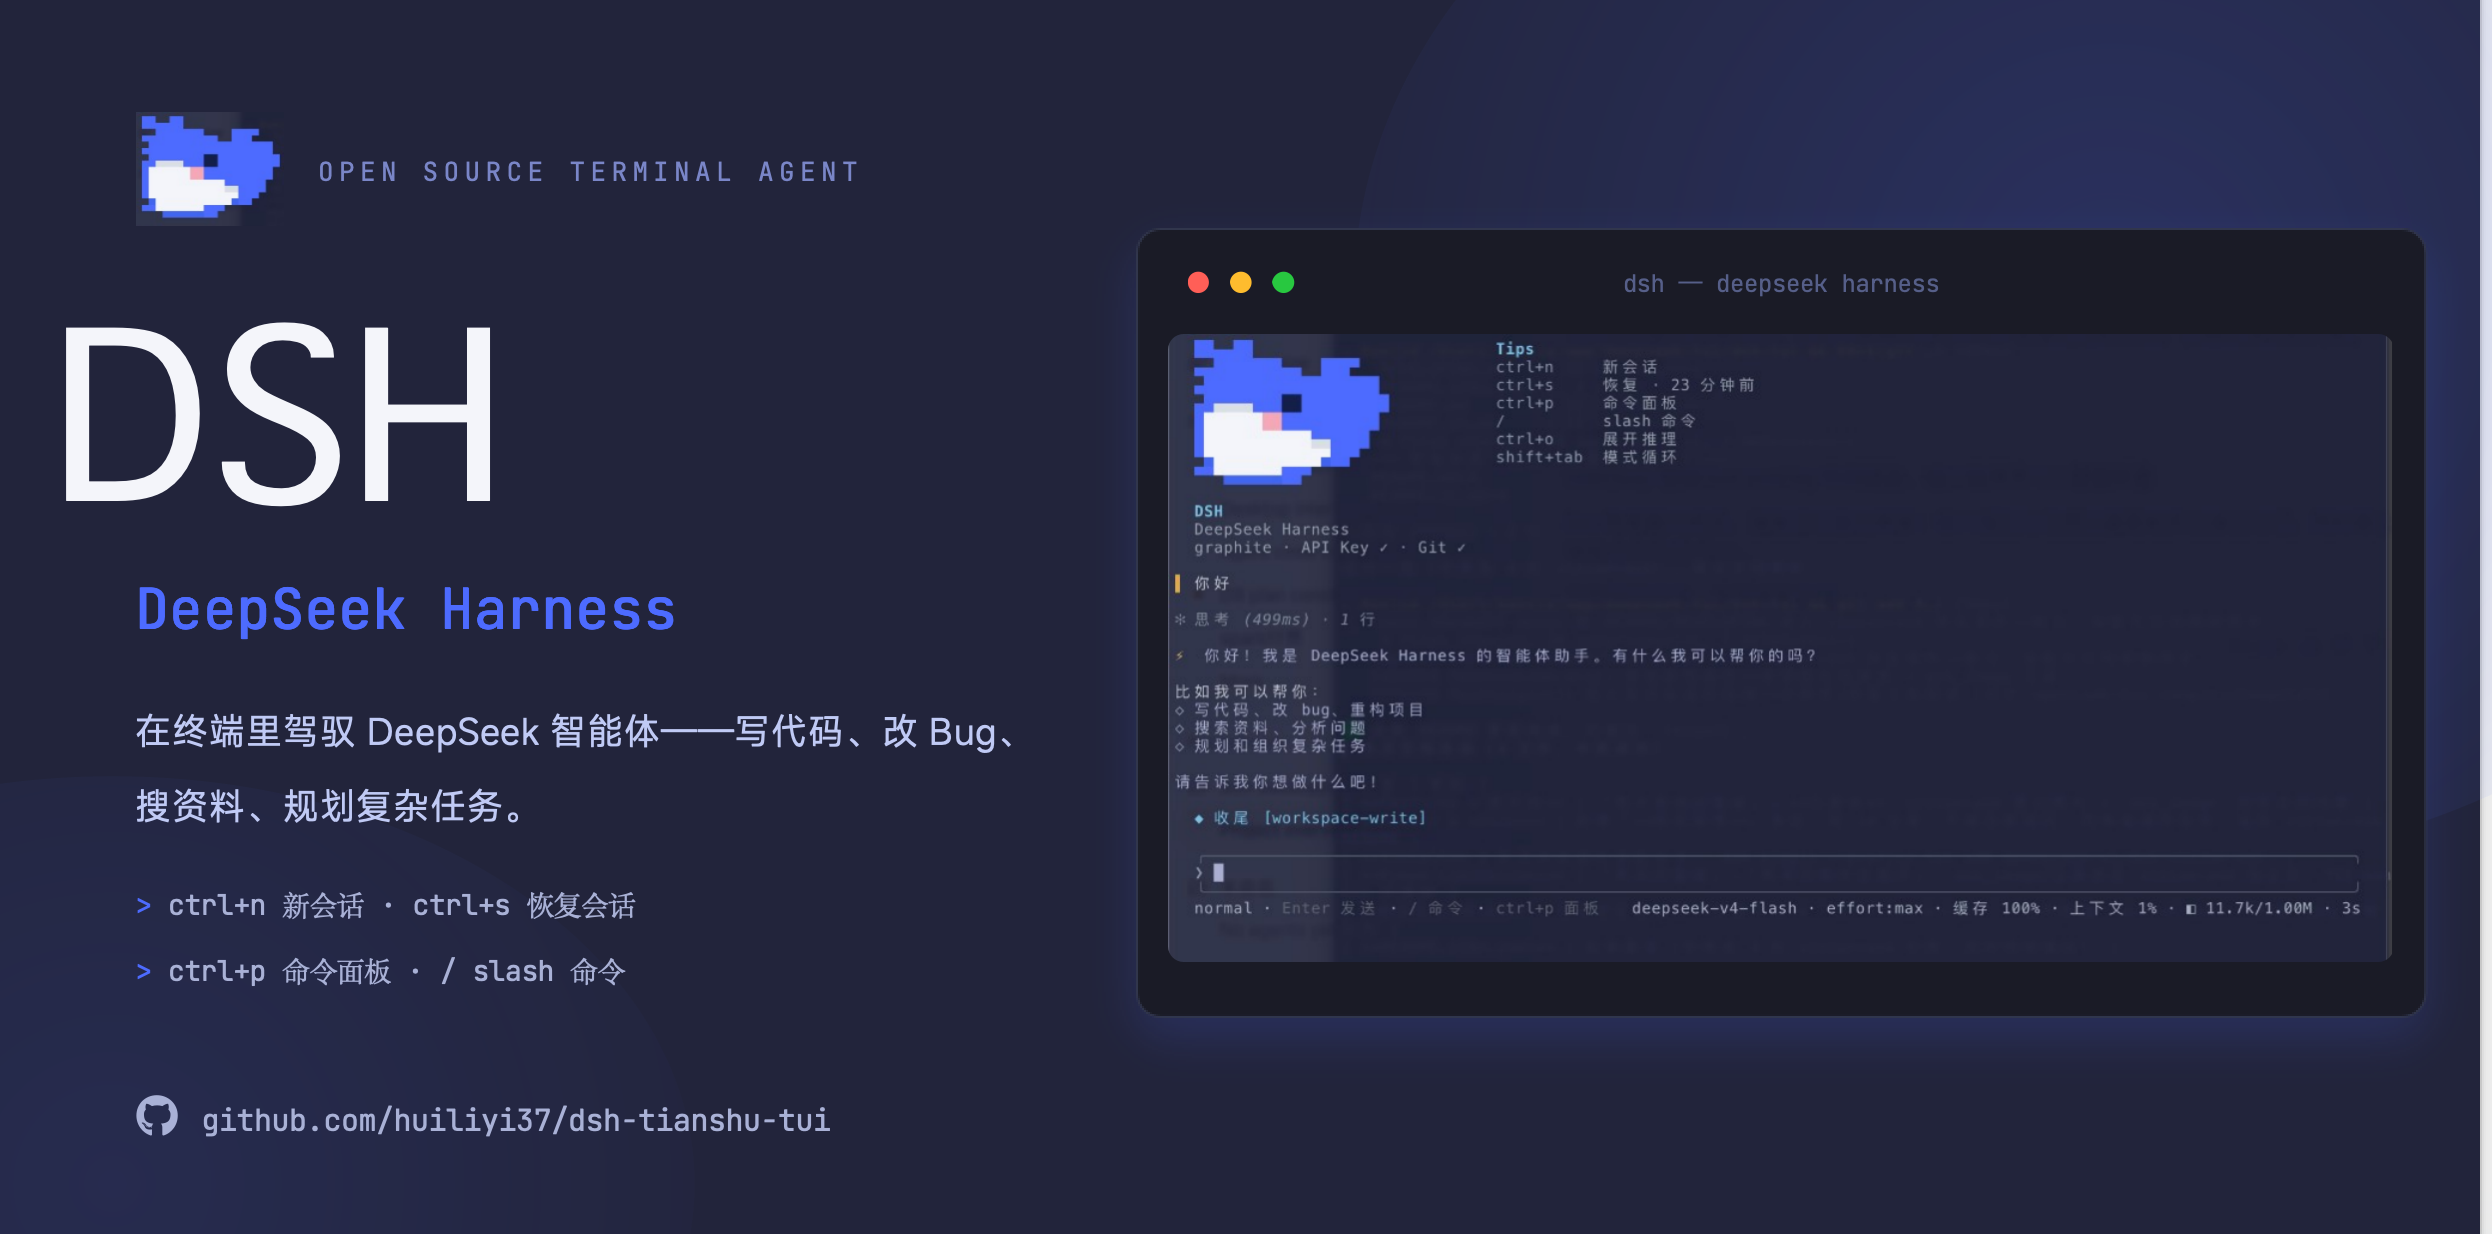 huiliyi37/dsh-tianshu-tui
官方 DeepSeek Harness 的交互式终端 UI 插件:自研 ANSI 极简交互渲染、流式 Markdown/工具卡、16+ 主题、slash 命令与选择器、输入历史与本地偏好持久化、LSP 诊断、memory记忆,很丝滑的开发体…
huiliyi37/dsh-tianshu-tui
官方 DeepSeek Harness 的交互式终端 UI 插件:自研 ANSI 极简交互渲染、流式 Markdown/工具卡、16+ 主题、slash 命令与选择器、输入历史与本地偏好持久化、LSP 诊断、memory记忆,很丝滑的开发体…