cute-baobao/dsh-usage-meter
DeepSeek Harness 使用记录器插件:按模型统计每小时 Token 使用量(输入/输出/缓存命中),并在 Web 界面中以堆叠柱状图仪表盘展示。
Project Overview项目介绍
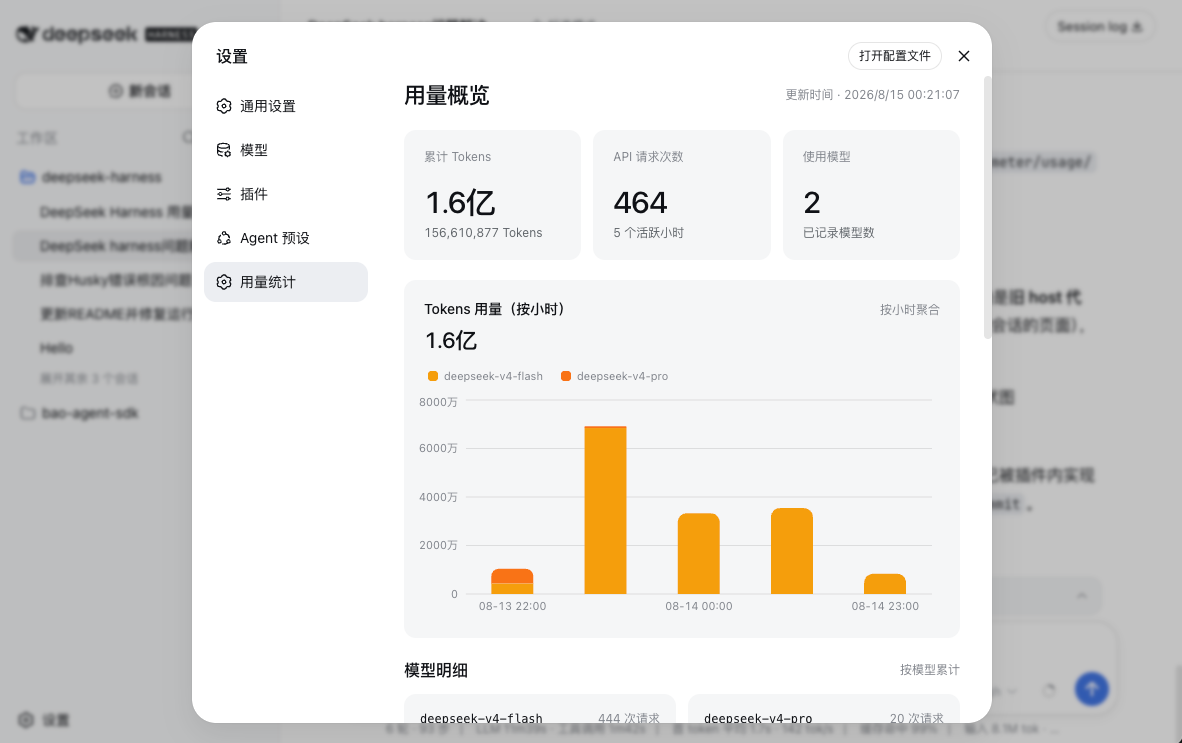
This is a native usage tracking plugin built exclusively for DeepSeek Harness. Its core function is to automatically log all token consumption by model calls within the DSH environment, so users can track their actual usage costs accurately. The plugin aggregates usage data by two dimensions: model type and hour of use. It renders the aggregated data as a stacked bar chart on the web-based DSH GUI settings page, where each hour gets its own bar and each model is assigned a unique color to make clear visual comparison easier.
To install the plugin, you need to have pnpm installed on your system first, then run the command pnpm dsh plugin --profile web add @dsh-usage-meter/usage in your terminal. If you run into a parsing error when installing on the same day the plugin is released, you can fix it by pinning an explicit version, like adding @0.3.0 to the end of the package name. After installation completes, you need to restart the dsh web service, then navigate to the settings section of DSH and find the "Usage Meter" entry to view your aggregated data. If you ever want to remove the plugin, you can run the uninstall command pnpm dsh plugin --profile web remove @dsh-usage-meter/usage.
All usage data collected by the plugin is stored in JSON Lines format at the path $DSH_HOME/usage-meter/usage.jsonl on your local machine. Every time the DSH application starts up, the plugin automatically re-aggregates all stored historical data by hour to refresh the displayed interactive chart. The plugin’s full user interface supports both simplified Chinese and English, and it automatically matches the current language setting of the DSH GUI. This project is released under the permissive open-source MIT license, which allows free use, modification, and redistribution of the code without restriction.
本项目是专为 DeepSeek Harness 开发的原生用量统计插件,核心功能是自动记录 DSH 运行过程中所有模型调用的 token 用量,方便用户跟踪使用成本。它会将数据按照「模型 × 小时」的维度进行聚合,最终在 DSH 的 Web GUI 设置页面以堆叠柱状图形式展示,每小时对应一根柱子,不同模型用不同颜色区分。
该插件可通过 pnpm 命令行工具安装,具体命令为 pnpm dsh plugin --profile web add @dsh-usage-meter/usage。安装完成后需要重启 dsh web 服务,之后进入 DSH 的设置页面,找到「用量统计」选项即可查看统计数据。如果刚发布当天安装出现解析失败的问题,可以通过显式指定版本号的方式解决,例如添加 @0.3.0 后缀后重新安装。
插件的统计数据以 JSONL 格式存储在 $DSH_HOME/usage-meter/usage.jsonl 路径下,程序启动时会自动按小时重新聚合数据。界面支持中英双语,会自动跟随 DSH GUI 的语言设置切换显示语言。项目采用 MIT 许可开源,用户可以免费使用、修改和分发代码,卸载可执行对应命令。
请帮我安装这个 DSH 插件。安装前先完成【兼容性检查 + 安全性检查】,检查通过再动手。

插件:dsh-usage-meter(cute-baobao/dsh-usage-meter)
仓库:https://github.com/cute-baobao/dsh-usage-meter
本站详情页:https://www.yhbd.top/plugins/cute-baobao-dsh-usage-meter/
本站登记:类型 plugin · 归类 原生 DSH 插件 · 许可证 MIT · ⭐ 3 · 最近提交 2026-08-14 · 主语言 TypeScript

按下面顺序执行,每步先把结论告诉我,再进入下一步:

【1 兼容性检查】
① 我这边:DSH 版本、Node 版本、操作系统、当前 profile(web / desktop)。
② 读它的 README、package.json、插件 manifest,列出它要求的 DSH 版本 / Node 版本 / 操作系统 / 外部依赖 / 需要另外先装的运行时。
③ 逐条比对,结论只写「满足 / 不满足 / 未知」三种;不满足的给出可行替代方案。
④ 检查是否和我已装的插件冲突:命令名重复、skill / tool 重名、端口占用、重复注册的 MCP server。

【2 安全性检查】
① 仓库可信度:和上面「本站登记」是否一致;star / fork 数、创建时间、最近提交,是否归档或长期停更。
② 安装脚本:逐行看 package.json 的 preinstall / install / postinstall,以及 install.sh、setup.ps1 之类脚本。出现 curl|bash、下载后直接执行、混淆代码、访问与插件功能无关的域名,立刻停下来告诉我,不要继续装。
③ 依赖:列出新增依赖,标出无人维护、或与知名包拼写近似的可疑包(typosquatting)。
④ 权限与副作用:它会读写哪些目录、访问哪些域名、需要哪些 DSH 权限(filesystem / network / shell / clipboard 等),以及怎么卸载和回滚。
⑤ 如果它要求 sudo / 管理员权限,或权限明显超出功能所需,先停下来问我。

【3 安装】
上面两步没有「不满足」和「高危项」时才执行;用官方推荐方式安装,不要自行提权。

【4 汇报】
用表格输出:检查项 / 结论 / 依据 / 是否需要我决策。拿不准的一律写「未知」并说明要我怎么确认——不要猜,也不要替我决定。
Send this message to DSH in your current session: it verifies compatibility and security first (answering met / not met / unknown item by item) and only installs once everything checks out — it will stop and ask you if it finds a high-risk item. The box scrolls; the copy is the full prompt. CLI install commands may not be accurate across systems, so DSH is the safer route.把上面这条消息直接发给当前会话里的 DSH:它会先核对兼容性与安全性(逐条给「满足 / 不满足 / 未知」),确认没问题再安装,有高危项会停下来问你。框内可滚动,复制到的是完整提示词;安装命令不一定准确,发给 DSH 更稳。
- Only 3 stars - very few users, little community feedback星标只有 3,几乎没人在用,遇到问题缺少社区反馈
DSH walks through these 9 checksDSH 会逐条核对这 9 项
Compatibility兼容性
- DSH, Node, OS and profile requirementsDSH 版本 / Node 版本 / 操作系统 / profile 是否满足要求
- External dependencies and runtimes (Electron / Python / Docker, ...)外部依赖与运行时(Electron / Python / Docker 等)是否齐备
- Conflicts with installed plugins: command names, skill / tool names, ports, duplicate MCP registration与已装插件是否冲突:命令名、skill / tool 重名、端口占用、重复 MCP 注册
Security安全性
- Repo matches the facts registered here; archived or abandoned?仓库是否与页面登记一致,是否归档或长期停更
- Safety of preinstall / install / postinstall and install.sh / setup.ps1preinstall / install / postinstall 与 install.sh、setup.ps1 是否安全
- curl|bash, download-then-execute, obfuscation, unrelated domains → stop immediatelycurl|bash、下载即执行、混淆代码、无关域名 → 立刻停止
- Typosquatting or unmaintained packages among the new dependencies新增依赖里有没有 typosquatting 或无人维护的包
- Requested permissions vs. what the feature actually needs申请了哪些权限、是否超出功能所需(filesystem / network / shell / clipboard)
- Any sudo / admin requirement, plus uninstall and rollback是否要求 sudo / 管理员权限,以及卸载与回滚方式
Anything uncertain must be marked unknown with a note on how to confirm it. This site's signal screen is a static snapshot, not a security audit.拿不准的必须标「未知」并说明要我怎么确认。本站的信号筛查是静态快照,不能替代安全审计。
Or use CLI install (for developers)或使用命令行安装(适合开发者)
CLI Install命令行安装
dsh plugin --profile web add github:cute-baobao/dsh-usage-meter把 cute-baobao/dsh-usage-meter 加入你的 DSH 配置(web profile)即可启用。
READMEREADME
dsh-usage-meter
DeepSeek Harness 用量统计插件:自动记录模型调用的 token 用量,按「模型 × 小时」聚合,在 Web GUI 设置页以堆叠柱状图展示(每小时一根柱子,按模型分色)。
🌐 English · 中文
安装
pnpm dsh plugin --profile web add @dsh-usage-meter/usage
刚发布当天若解析失败,显式钉版本(如
@dsh-usage-meter/usage@0.3.0)即可。
重启 dsh web,设置 → 用量统计 即可查看。
卸载
pnpm dsh plugin --profile web remove @dsh-usage-meter/usage
数据
记录在 $DSH_HOME/usage-meter/usage.jsonl,启动时按小时重新聚合;界面中英双语,跟随 GUI 语言。
许可
MIT
Related相关推荐
-
 wssfk12138/dsh-damage-pulse
DeepSeek Harness Token 余额监控插件:鲸鱼娘待机/扣费/复苏动画、峰谷计费、连续扣费飘字与会话费用统计。
wssfk12138/dsh-damage-pulse
DeepSeek Harness Token 余额监控插件:鲸鱼娘待机/扣费/复苏动画、峰谷计费、连续扣费飘字与会话费用统计。
-
 Ychris12138/dsh-usage-stats
Provider balances, subscription quotas, and token-usage analytics for the DeepSeek Harness Web GUI (dsh web).
Ychris12138/dsh-usage-stats
Provider balances, subscription quotas, and token-usage analytics for the DeepSeek Harness Web GUI (dsh web).
-
 JingbiaoMei/Tokdash
Agent Dashboard: Visualization and analytics for Sessions and Quota Usage. Track, analyze, and optimize token usage acro…
JingbiaoMei/Tokdash
Agent Dashboard: Visualization and analytics for Sessions and Quota Usage. Track, analyze, and optimize token usage acro…
-
 yxxbc/dsh-balance-plugin
deepSeek 余额监控与用量统计(DSH 动态 Cordis 插件):余额监控 · 官方充值入口 · 用量统计 · 三方插件管理
yxxbc/dsh-balance-plugin
deepSeek 余额监控与用量统计(DSH 动态 Cordis 插件):余额监控 · 官方充值入口 · 用量统计 · 三方插件管理
-
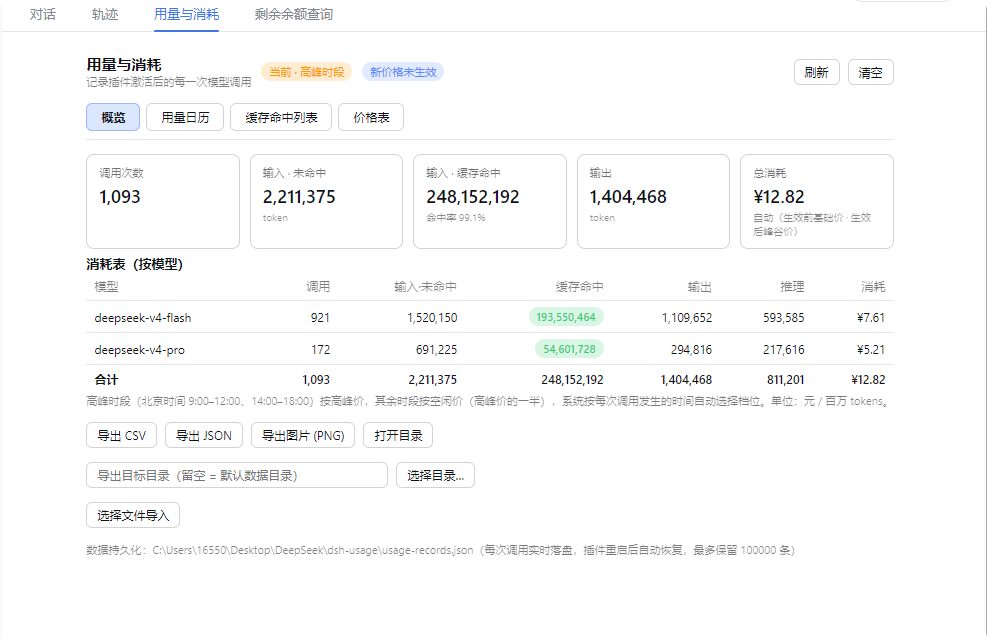 feiyang-dev/dsh-usage-plugin
DeepSeek Harness 用量与消耗插件(dsh-usage-plugin)—— 每次调用的 token 用量/缓存命中统计、峰谷计费、余额查询、CSV/JSON/PNG 导出,可经桌面端一键安装或命令行 dsh plugin ad…
feiyang-dev/dsh-usage-plugin
DeepSeek Harness 用量与消耗插件(dsh-usage-plugin)—— 每次调用的 token 用量/缓存命中统计、峰谷计费、余额查询、CSV/JSON/PNG 导出,可经桌面端一键安装或命令行 dsh plugin ad…
-
 LaoYueHanNi/dsh-token-usage
贴近 DSH 原生设计风格的 token 用量统计插件:实时记录每次请求的用量与费用,在 Web UI 中提供趋势图表、按模型定价明细和供应商配额显示。
LaoYueHanNi/dsh-token-usage
贴近 DSH 原生设计风格的 token 用量统计插件:实时记录每次请求的用量与费用,在 Web UI 中提供趋势图表、按模型定价明细和供应商配额显示。
-
 lanlandeli/dsh-usage-stats
DeepSeek Harness 使用统计插件|Token 总量与构成、7/30 天趋势、年度活跃热力图、模型占比、工作区/任务筛选、CSV/JSON 导出
lanlandeli/dsh-usage-stats
DeepSeek Harness 使用统计插件|Token 总量与构成、7/30 天趋势、年度活跃热力图、模型占比、工作区/任务筛选、CSV/JSON 导出
-
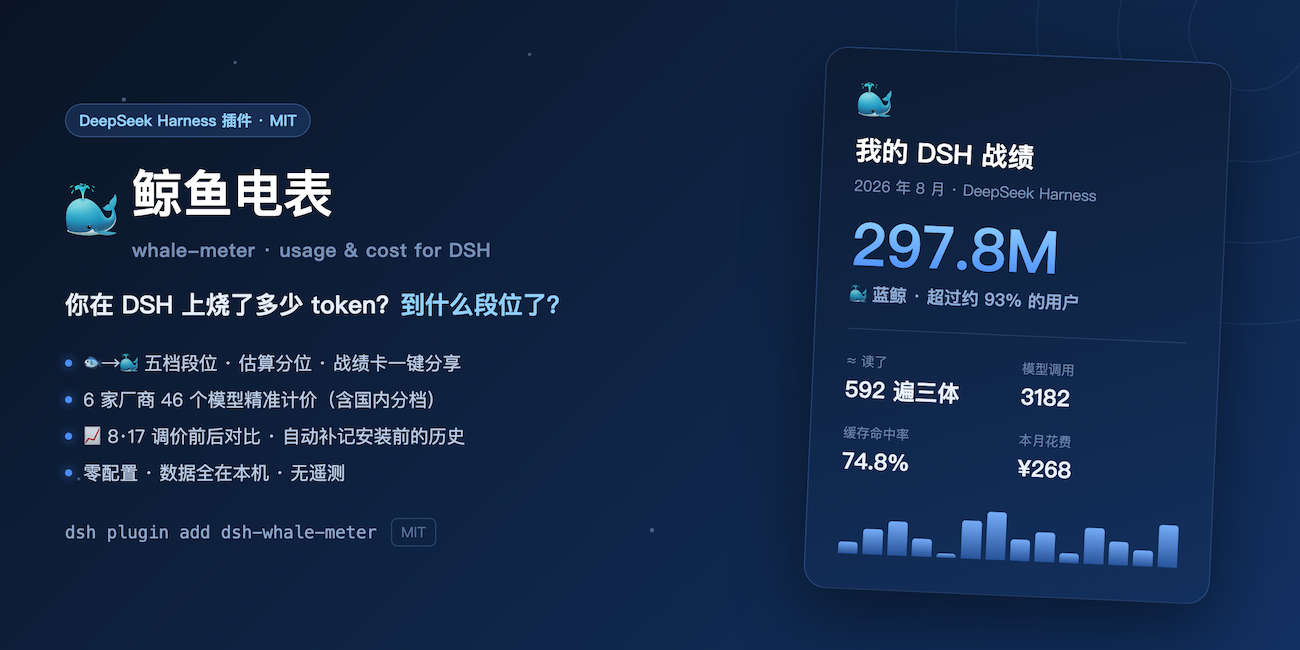 Shiye-10Pages/dsh-whale-meter
🐳 鲸鱼电表:你在 DeepSeek Harness 上烧了多少 token?消耗量段位、可晒的战绩卡、6 家厂商 46 个模型精准计价(含国内分档)、8·17 调价前后对比。零配置,数据全在本机 | Token usage tiers …
Shiye-10Pages/dsh-whale-meter
🐳 鲸鱼电表:你在 DeepSeek Harness 上烧了多少 token?消耗量段位、可晒的战绩卡、6 家厂商 46 个模型精准计价(含国内分档)、8·17 调价前后对比。零配置,数据全在本机 | Token usage tiers …