cute-baobao/dsh-usage-meter
DeepSeek Harness 使用记录器插件:按模型统计每小时 Token 使用量(输入/输出/缓存命中),并在 Web 界面中以堆叠柱状图仪表盘展示。
Project Overview项目介绍
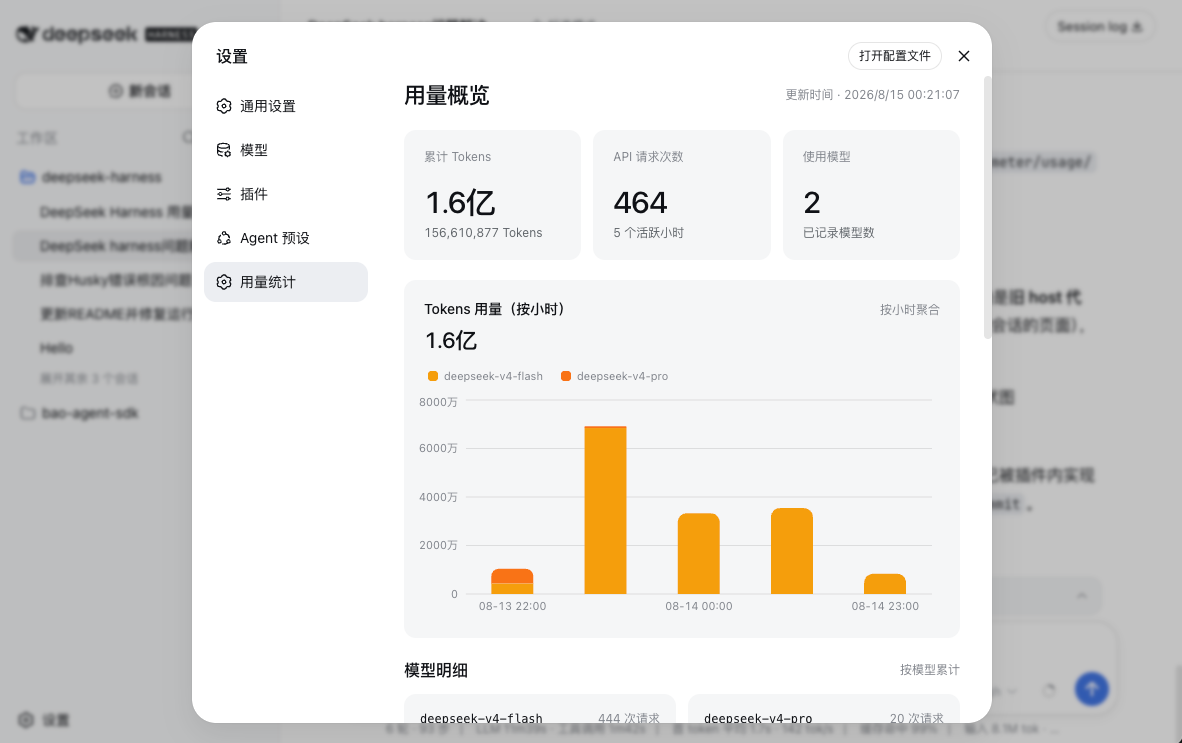
dsh-usage-meter is a usage statistics plugin for DeepSeek Harness. It automatically records token consumption from each model call, aggregates by model and hour, and displays a stacked bar chart in the Web GUI settings page, one bar per hour colored by model. Use it when you need to analyze per-model call cost and load over time windows. Raw data is stored in $DSH_HOME/usage-meter/usage.jsonl and re-aggregated hourly on startup. Note: right after release, if CLI resolution fails, explicitly pin the version.
dsh-usage-meter 是 DeepSeek Harness 的用量统计插件。它自动记录每次模型调用的 token 消耗,按「模型 × 小时」维度聚合,在 Web GUI 设置页以堆叠柱状图展示,每小时一根柱子并按模型分色。适合需要按时间窗口分析各模型调用成本与负载的用户。原始数据存于 $DSH_HOME/usage-meter/usage.jsonl,启动时按小时重新聚合。注意:插件刚发布时若 CLI 解析失败,请显式钉住版本号。
请帮我了解并安装插件:【dsh-usage-meter】【https://github.com/cute-baobao/dsh-usage-meter】Send this message to DSH in your current session. CLI install commands may not be accurate across systems — DSH will figure it out for you.把上面这条消息直接发给当前会话里的 DSH,让它帮你了解并安装。安装命令不一定准确,发给 DSH 更稳。
Or use CLI install (for developers)或使用命令行安装(适合开发者)
CLI Install命令行安装
dsh plugin --profile web add github:cute-baobao/dsh-usage-meter把 cute-baobao/dsh-usage-meter 加入你的 DSH 配置(web profile)即可启用。
READMEREADME
dsh-usage-meter
DeepSeek Harness 用量统计插件:自动记录模型调用的 token 用量,按「模型 × 小时」聚合,在 Web GUI 设置页以堆叠柱状图展示(每小时一根柱子,按模型分色)。
🌐 English · 中文
安装
pnpm dsh plugin --profile web add @dsh-usage-meter/usage
刚发布当天若解析失败,显式钉版本(如
@dsh-usage-meter/usage@0.3.0)即可。
重启 dsh web,设置 → 用量统计 即可查看。
卸载
pnpm dsh plugin --profile web remove @dsh-usage-meter/usage
数据
记录在 $DSH_HOME/usage-meter/usage.jsonl,启动时按小时重新聚合;界面中英双语,跟随 GUI 语言。
许可
MIT
Related相关推荐
-
 wssfk12138/dsh-damage-pulse
DeepSeek Harness Token 余额监控插件:鲸鱼娘待机/扣费/复苏动画、峰谷计费、连续扣费飘字与会话费用统计。
wssfk12138/dsh-damage-pulse
DeepSeek Harness Token 余额监控插件:鲸鱼娘待机/扣费/复苏动画、峰谷计费、连续扣费飘字与会话费用统计。
-
 Ychris12138/dsh-usage-stats
Provider balances, subscription quotas, and token-usage analytics for the DeepSeek Harness Web GUI (dsh web).
Ychris12138/dsh-usage-stats
Provider balances, subscription quotas, and token-usage analytics for the DeepSeek Harness Web GUI (dsh web).
-
 yxxbc/dsh-balance-plugin
deepSeek 余额监控与用量统计(DSH 动态 Cordis 插件):余额监控 · 官方充值入口 · 用量统计 · 三方插件管理
yxxbc/dsh-balance-plugin
deepSeek 余额监控与用量统计(DSH 动态 Cordis 插件):余额监控 · 官方充值入口 · 用量统计 · 三方插件管理
-
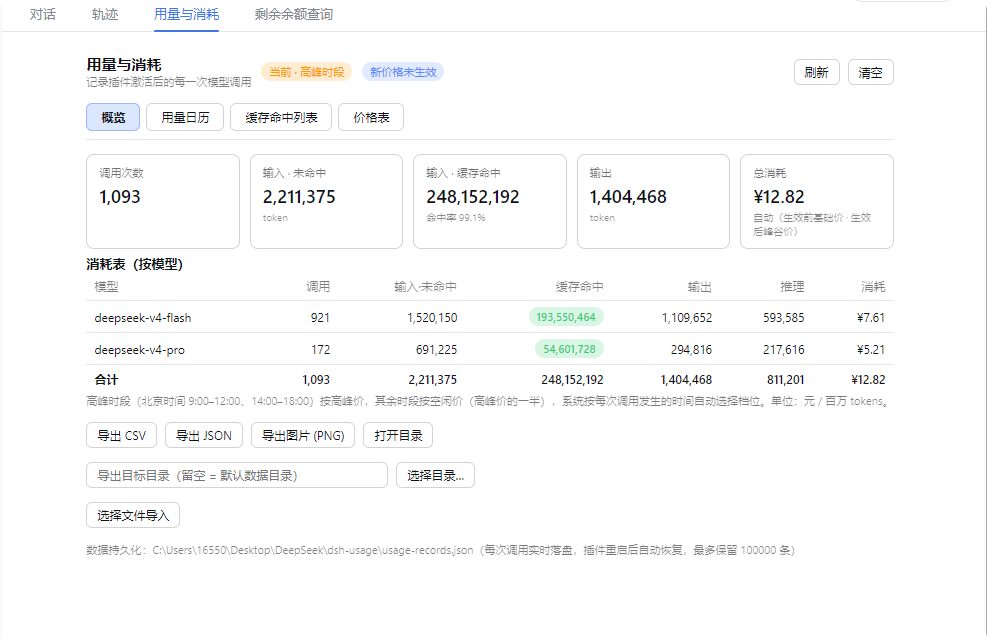 feiyang-dev/dsh-usage-plugin
DeepSeek Harness 用量与消耗插件(dsh-usage-plugin)—— 每次调用的 token 用量/缓存命中统计、峰谷计费、余额查询、CSV/JSON/PNG 导出,可经桌面端一键安装或命令行 dsh plugin ad…
feiyang-dev/dsh-usage-plugin
DeepSeek Harness 用量与消耗插件(dsh-usage-plugin)—— 每次调用的 token 用量/缓存命中统计、峰谷计费、余额查询、CSV/JSON/PNG 导出,可经桌面端一键安装或命令行 dsh plugin ad…
-
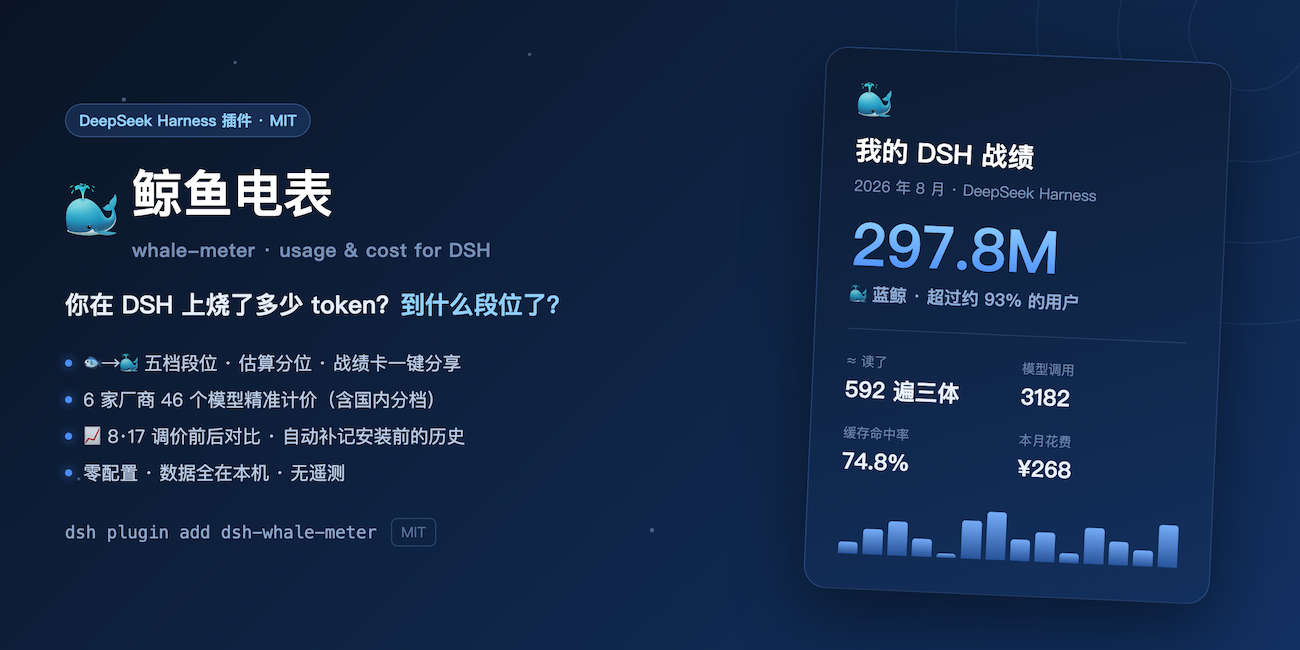 Shiye-10Pages/dsh-whale-meter
🐳 鲸鱼电表:你在 DeepSeek Harness 上烧了多少 token?消耗量段位、可晒的战绩卡、6 家厂商 46 个模型精准计价(含国内分档)、8·17 调价前后对比。零配置,数据全在本机 | Token usage tiers …
Shiye-10Pages/dsh-whale-meter
🐳 鲸鱼电表:你在 DeepSeek Harness 上烧了多少 token?消耗量段位、可晒的战绩卡、6 家厂商 46 个模型精准计价(含国内分档)、8·17 调价前后对比。零配置,数据全在本机 | Token usage tiers …
-
 LaoYueHanNi/dsh-token-usage
贴近 DSH 原生设计风格的 token 用量统计插件:实时记录每次请求的用量与费用,在 Web UI 中提供趋势图表、按模型定价明细和供应商配额显示。
LaoYueHanNi/dsh-token-usage
贴近 DSH 原生设计风格的 token 用量统计插件:实时记录每次请求的用量与费用,在 Web UI 中提供趋势图表、按模型定价明细和供应商配额显示。
-
 lanlandeli/dsh-usage-stats
DeepSeek Harness 使用统计插件|Token 总量与构成、7/30 天趋势、年度活跃热力图、模型占比、工作区/任务筛选、CSV/JSON 导出
lanlandeli/dsh-usage-stats
DeepSeek Harness 使用统计插件|Token 总量与构成、7/30 天趋势、年度活跃热力图、模型占比、工作区/任务筛选、CSV/JSON 导出
-
 OK-wx/dsh-ocgo-lite
OpenCode Go 用量常驻条:套餐余量圆环 + token/花费实时统计(本次会话/全部范围 + 按模型联动,官方实时定价),一键复制 API Key。OpenCode Go usage bar for DeepSeek Harnes…
OK-wx/dsh-ocgo-lite
OpenCode Go 用量常驻条:套餐余量圆环 + token/花费实时统计(本次会话/全部范围 + 按模型联动,官方实时定价),一键复制 API Key。OpenCode Go usage bar for DeepSeek Harnes…