skkjkk/dsh-usage-dashboard
DSH(DeepSeek Harness)使用统计仪表盘插件:支持令牌数、成本、时长、会话聚合,并提供趋势、热力图和日历视图。
Project Overview项目介绍
dsh-usage-dashboard is a native bundle plugin built exclusively for the DeepSeek Harness (DSH) Web GUI. It enables DSH users to view local aggregated statistics of their token usage, estimated cost, session duration, and session details directly within DSH, without sending any session data to external servers. The plugin reads DSH’s local session data directly and adds a dedicated dashboard entry under DSH’s Settings → Data Dashboard menu after installation. To install, users can run the DSH CLI command dsh plugin --profile web add @skkjkk/dsh-usage-dashboard for automatic setup, or manually add the package to their DSH web profile’s bundle list if they do not use the CLI.
This plugin is designed for any DSH user who wants to track their LLM usage and manage their spending over time. After opening the dashboard, users can adjust filters for time range, selected models, and DSH work projects to narrow down the data they want to analyze. All filter and display preferences are cached in the browser’s localStorage, so they persist across DSH restarts and plugin reloads. The dashboard provides multiple visualizations including KPI overview cards, trend graphs, heatmaps for active usage, distribution charts, session detail tables, a model performance radar chart, and a cache hit rate trend line.
dsh-usage-dashboard is released under the open-source Apache-2.0 license, with no associated cost or paid features. It includes an internally maintained pricing table that covers 245 models, and supports DeepSeek V4’s peak/off-peak pricing structure that launched in August 2026. All data aggregation is done locally using an optimized incremental engine that processes existing sessions on startup and incrementally updates data as new sessions are created, checking for changes every 60 seconds. This engine delivers millisecond response times for all dashboard views after initial startup. Users should note that all cost values shown are estimates only, and do not represent actual billing from LLM providers.
这是专为 DeepSeek Harness(DSH)Web 界面开发的原生 DSH bundle 插件,用于在本地展示 DSH 的用量统计与费用预估看板。插件会直接读取 DSH 本地存储的会话数据,在「设置 → 数据看板」页面提供完整统计功能,所有数据聚合与统计均在本机完成,不会向任何外部服务上传会话内容或衍生数据。推荐通过 DSH CLI 安装,执行对应命令即可自动完成配置。
插件面向需要追踪自身 DSH Token 使用情况与费用消耗的用户,提供多维度的用量分析能力。核心功能包含 KPI 总览卡片、多粒度趋势图、分时活跃热力图、模型与项目占比环形图、日历热力图、会话明细记录表、模型效能雷达图、缓存命中率趋势图。用户可按时间范围、模型、项目筛选数据,筛选偏好和显示设置会缓存在本地,重启 DSH 后仍会保留。
本插件采用 Apache-2.0 许可证开源,内置的定价表覆盖了 245 个模型,支持 DeepSeek V4 自 2026 年 8 月起实施的工作日高峰/空闲时段分阶梯费规则。所有数据处理都在本地完成,不会上传任何用户会话数据,保障隐私。插件采用增量聚合引擎优化性能,启动后视图请求均可在毫秒级返回,费用为估算值,不代表实际账单。
请帮我安装这个 DSH 插件。安装前先完成【兼容性检查 + 安全性检查】,检查通过再动手。

插件:dsh-usage-dashboard(skkjkk/dsh-usage-dashboard)
仓库:https://github.com/skkjkk/dsh-usage-dashboard
本站详情页:https://www.yhbd.top/plugins/skkjkk-dsh-usage-dashboard/
本站登记:类型 plugin · 归类 原生 DSH 插件 · 许可证 Apache-2.0 · ⭐ 3 · 最近提交 2026-09-30 · 主语言 JavaScript

按下面顺序执行,每步先把结论告诉我,再进入下一步:

【1 兼容性检查】
① 我这边:DSH 版本、Node 版本、操作系统、当前 profile(web / desktop)。
② 读它的 README、package.json、插件 manifest,列出它要求的 DSH 版本 / Node 版本 / 操作系统 / 外部依赖 / 需要另外先装的运行时。
③ 逐条比对,结论只写「满足 / 不满足 / 未知」三种;不满足的给出可行替代方案。
④ 检查是否和我已装的插件冲突:命令名重复、skill / tool 重名、端口占用、重复注册的 MCP server。

【2 安全性检查】
① 仓库可信度:和上面「本站登记」是否一致;star / fork 数、创建时间、最近提交,是否归档或长期停更。
② 安装脚本:逐行看 package.json 的 preinstall / install / postinstall,以及 install.sh、setup.ps1 之类脚本。出现 curl|bash、下载后直接执行、混淆代码、访问与插件功能无关的域名,立刻停下来告诉我,不要继续装。
③ 依赖:列出新增依赖,标出无人维护、或与知名包拼写近似的可疑包(typosquatting)。
④ 权限与副作用:它会读写哪些目录、访问哪些域名、需要哪些 DSH 权限(filesystem / network / shell / clipboard 等),以及怎么卸载和回滚。
⑤ 如果它要求 sudo / 管理员权限,或权限明显超出功能所需,先停下来问我。

【3 安装】
上面两步没有「不满足」和「高危项」时才执行;用官方推荐方式安装,不要自行提权。

【4 汇报】
用表格输出:检查项 / 结论 / 依据 / 是否需要我决策。拿不准的一律写「未知」并说明要我怎么确认——不要猜,也不要替我决定。
Send this message to DSH in your current session: it verifies compatibility and security first (answering met / not met / unknown item by item) and only installs once everything checks out — it will stop and ask you if it finds a high-risk item. The box scrolls; the copy is the full prompt. CLI install commands may not be accurate across systems, so DSH is the safer route.把上面这条消息直接发给当前会话里的 DSH:它会先核对兼容性与安全性(逐条给「满足 / 不满足 / 未知」),确认没问题再安装,有高危项会停下来问你。框内可滚动,复制到的是完整提示词;安装命令不一定准确,发给 DSH 更稳。
- Only 3 stars - very few users, little community feedback星标只有 3,几乎没人在用,遇到问题缺少社区反馈
DSH walks through these 9 checksDSH 会逐条核对这 9 项
Compatibility兼容性
- DSH, Node, OS and profile requirementsDSH 版本 / Node 版本 / 操作系统 / profile 是否满足要求
- External dependencies and runtimes (Electron / Python / Docker, ...)外部依赖与运行时(Electron / Python / Docker 等)是否齐备
- Conflicts with installed plugins: command names, skill / tool names, ports, duplicate MCP registration与已装插件是否冲突:命令名、skill / tool 重名、端口占用、重复 MCP 注册
Security安全性
- Repo matches the facts registered here; archived or abandoned?仓库是否与页面登记一致,是否归档或长期停更
- Safety of preinstall / install / postinstall and install.sh / setup.ps1preinstall / install / postinstall 与 install.sh、setup.ps1 是否安全
- curl|bash, download-then-execute, obfuscation, unrelated domains → stop immediatelycurl|bash、下载即执行、混淆代码、无关域名 → 立刻停止
- Typosquatting or unmaintained packages among the new dependencies新增依赖里有没有 typosquatting 或无人维护的包
- Requested permissions vs. what the feature actually needs申请了哪些权限、是否超出功能所需(filesystem / network / shell / clipboard)
- Any sudo / admin requirement, plus uninstall and rollback是否要求 sudo / 管理员权限,以及卸载与回滚方式
Anything uncertain must be marked unknown with a note on how to confirm it. This site's signal screen is a static snapshot, not a security audit.拿不准的必须标「未知」并说明要我怎么确认。本站的信号筛查是静态快照,不能替代安全审计。
Or use CLI install (for developers)或使用命令行安装(适合开发者)
CLI Install命令行安装
dsh plugin --profile web add @skkjkk/dsh-usage-dashboard把 skkjkk/dsh-usage-dashboard 加入你的 DSH 配置(web profile)即可启用。
READMEREADME
dsh-usage-dashboard
面向 DSH(DeepSeek Harness)Web GUI 的本地用量看板:Token、费用、时长与会话明细,全部在本机聚合,不上传任何会话内容。
🌐 语言 / Language: English · 中文



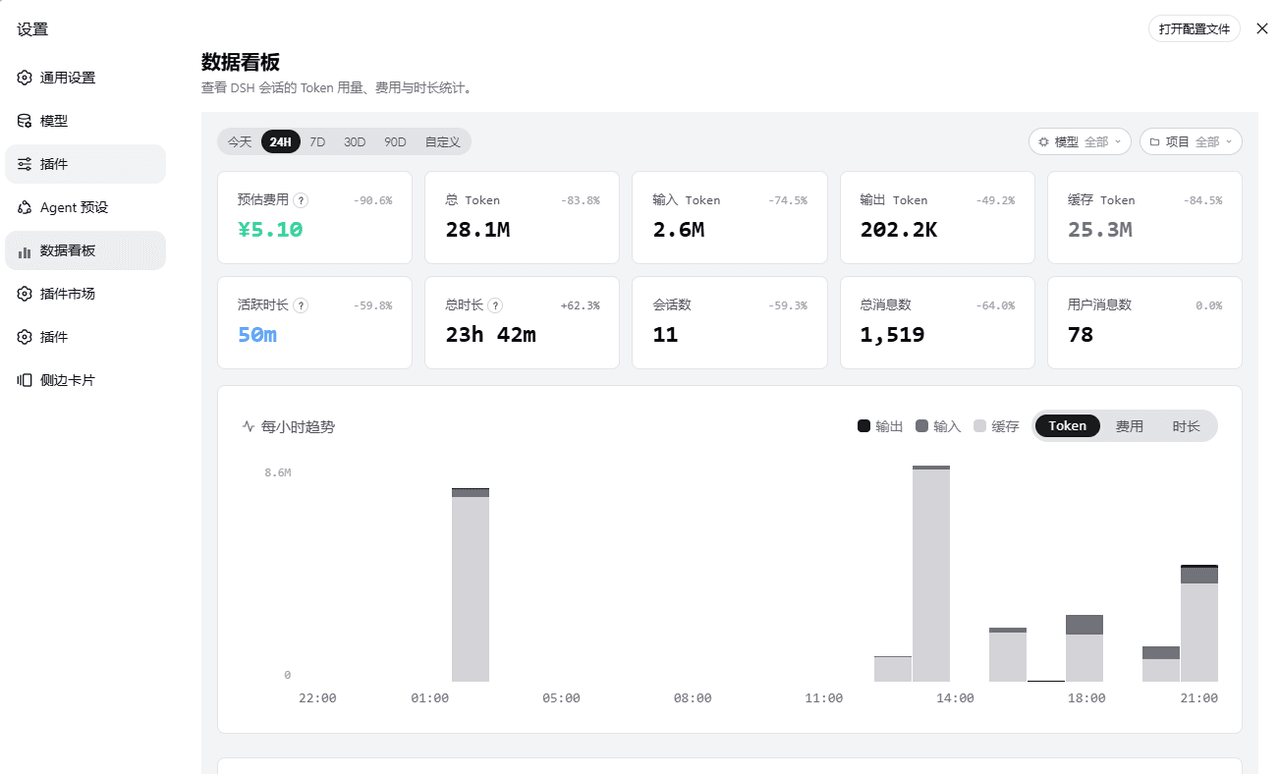
dsh-usage-dashboard 是一个 DSH bundle 插件。它直接读取 DSH 本地会话数据,在 设置 → 数据看板 中提供用量统计。所有聚合都在本机完成,不会向外部服务发送任何会话内容。
交互参考 VibeCafe.ai 的 Vibe Usage,提供指标切换、分布 hover 与明细浏览;统计与聚合完全在本地完成。
功能
筛选与时间范围
顶部筛选器支持时间范围 今天 / 24H / 7D / 30D / 90D / 自定义(自定义可填起止日期);模型筛选为多选、按厂商分组(可展开勾选具体模型,选中后按钮显示「N项」);项目下拉可选单个项目;有筛选时可一键清除。所选范围、筛选与显示偏好保存在本地(localStorage),重开设置或重载插件后仍保留。数据刷新期间显示「统计中」。
KPI 总览
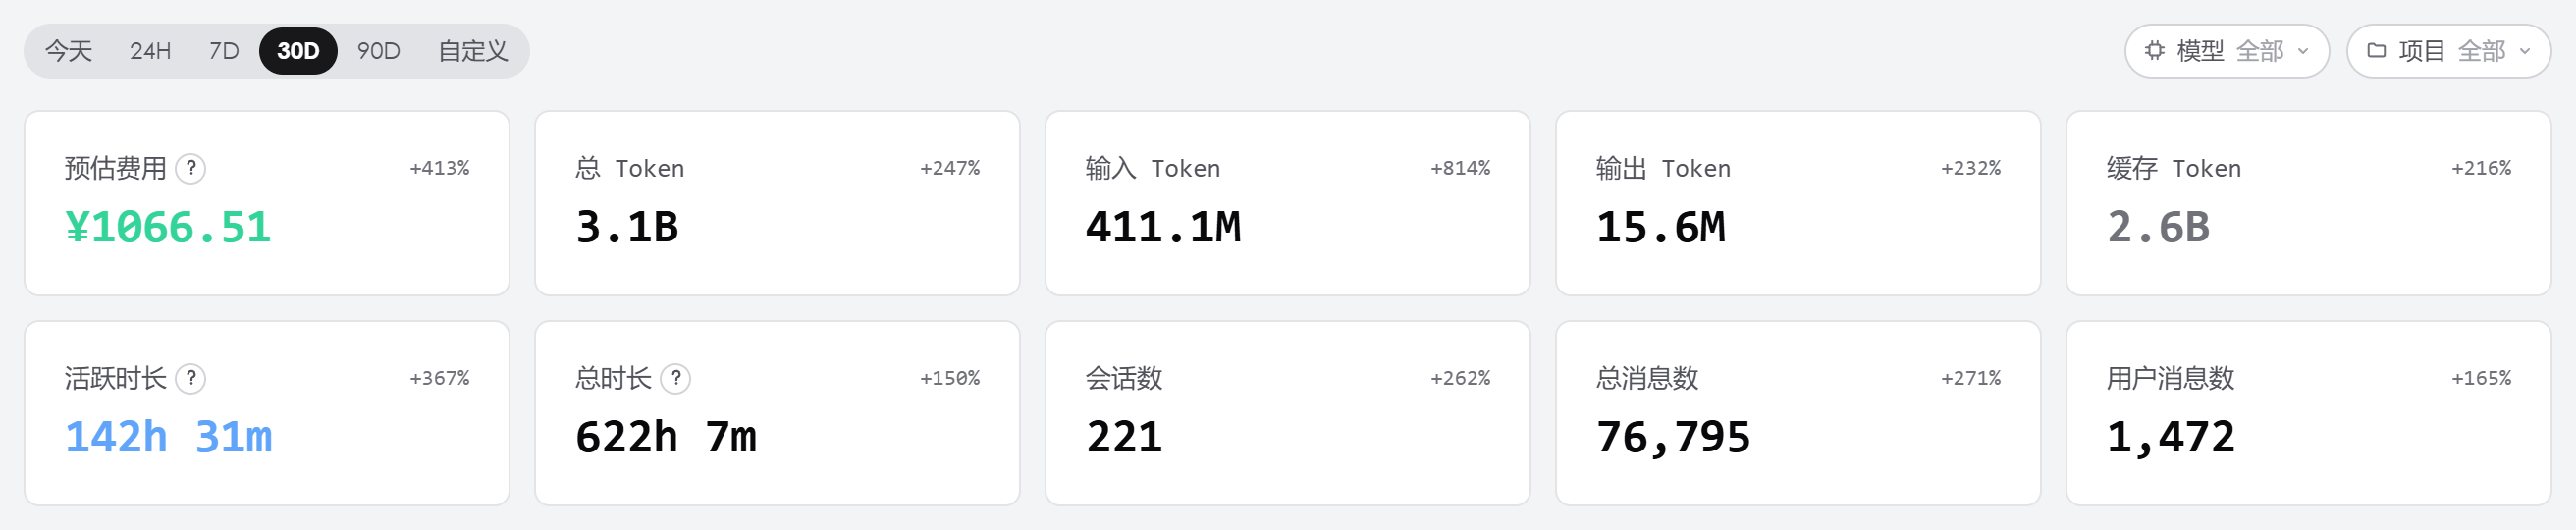
共 9 张指标卡片:预估费用、总 Token、输入 / 输出 / 缓存 Token、活跃时长、总时长、会话数、总消息数、用户消息数。每张卡片带相对上一周期的环比百分比(基线为零时隐藏)。
- 点击费用卡片在 ¥ / $ 间切换;点击总 Token 或缓存 Token 卡片在国际单位(K/M/B)与中文单位(万 / 亿)间切换,四个 Token 卡片共用同一单位。
- 选择模型筛选后,时长与会话类卡片自动收起,仅保留费用与 Token 五项。
- 「预估费用」「活跃时长」「总时长」标题旁的 ⓘ 可展开说明弹窗(定价覆盖与峰谷规则、两种时长口径差异)。
趋势图
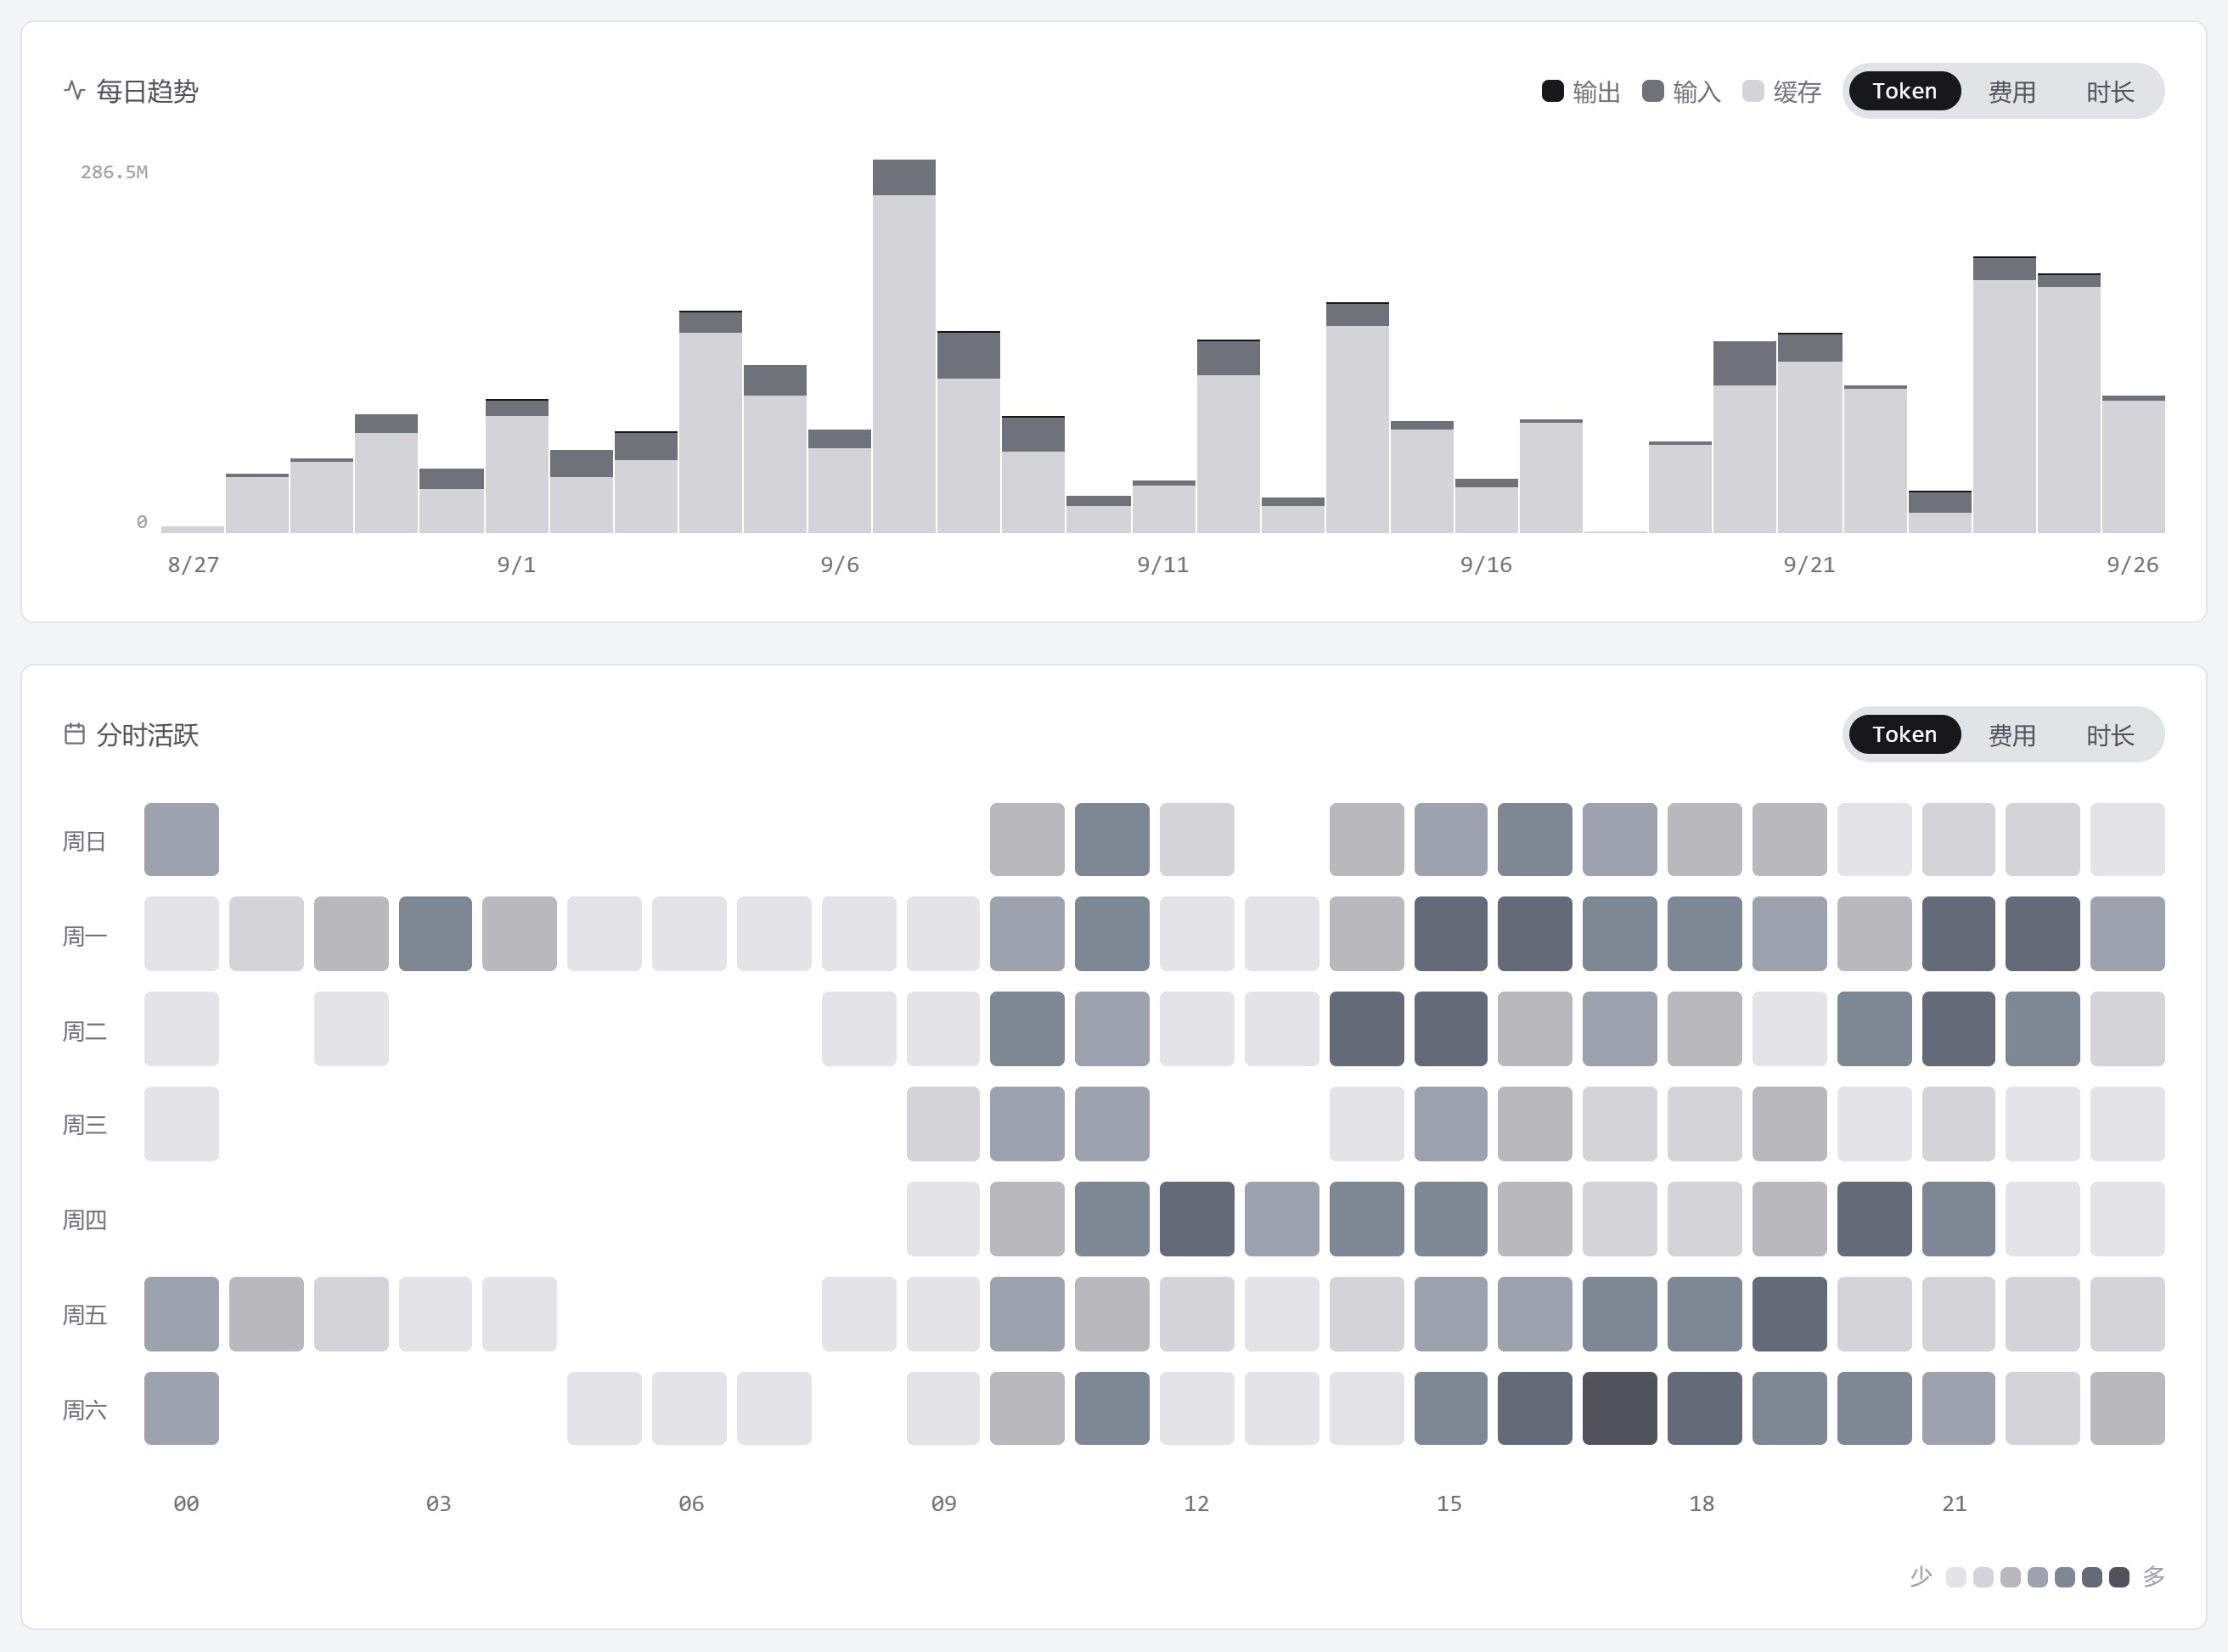
随所选范围自动切换粒度:今天 / 24H 为每小时,7D / 30D 为每日,90D 为每周(自定义范围按跨度:≤48 小时用小时、≤62 天用天,更长用周)。可在 Token / 费用 / 时长 三种口径间切换:
- Token:输出 / 输入 / 缓存分段堆叠,图例可单独显隐;
- 费用:按桶汇总的估算费用;
- 时长:区分活跃时长与总时长,图例同样可单独显隐。
点击任意柱子高亮该项(其余变淡),再次点击空白处取消;悬停查看明细。X 轴标签按固定步长标注(今天每 3 小时一格、30D 每 4/5 天一格、90D 每 2 周一格)。
分时活跃热力图
7 行(周几)× 24 列(小时) 网格,可在 Token / 费用 / 时长 三种指标间切换;悬停任意单元格显示精确数值与时刻,图例为 少 → 多。(上图下半部分即为此图。)
模型分布与项目分布
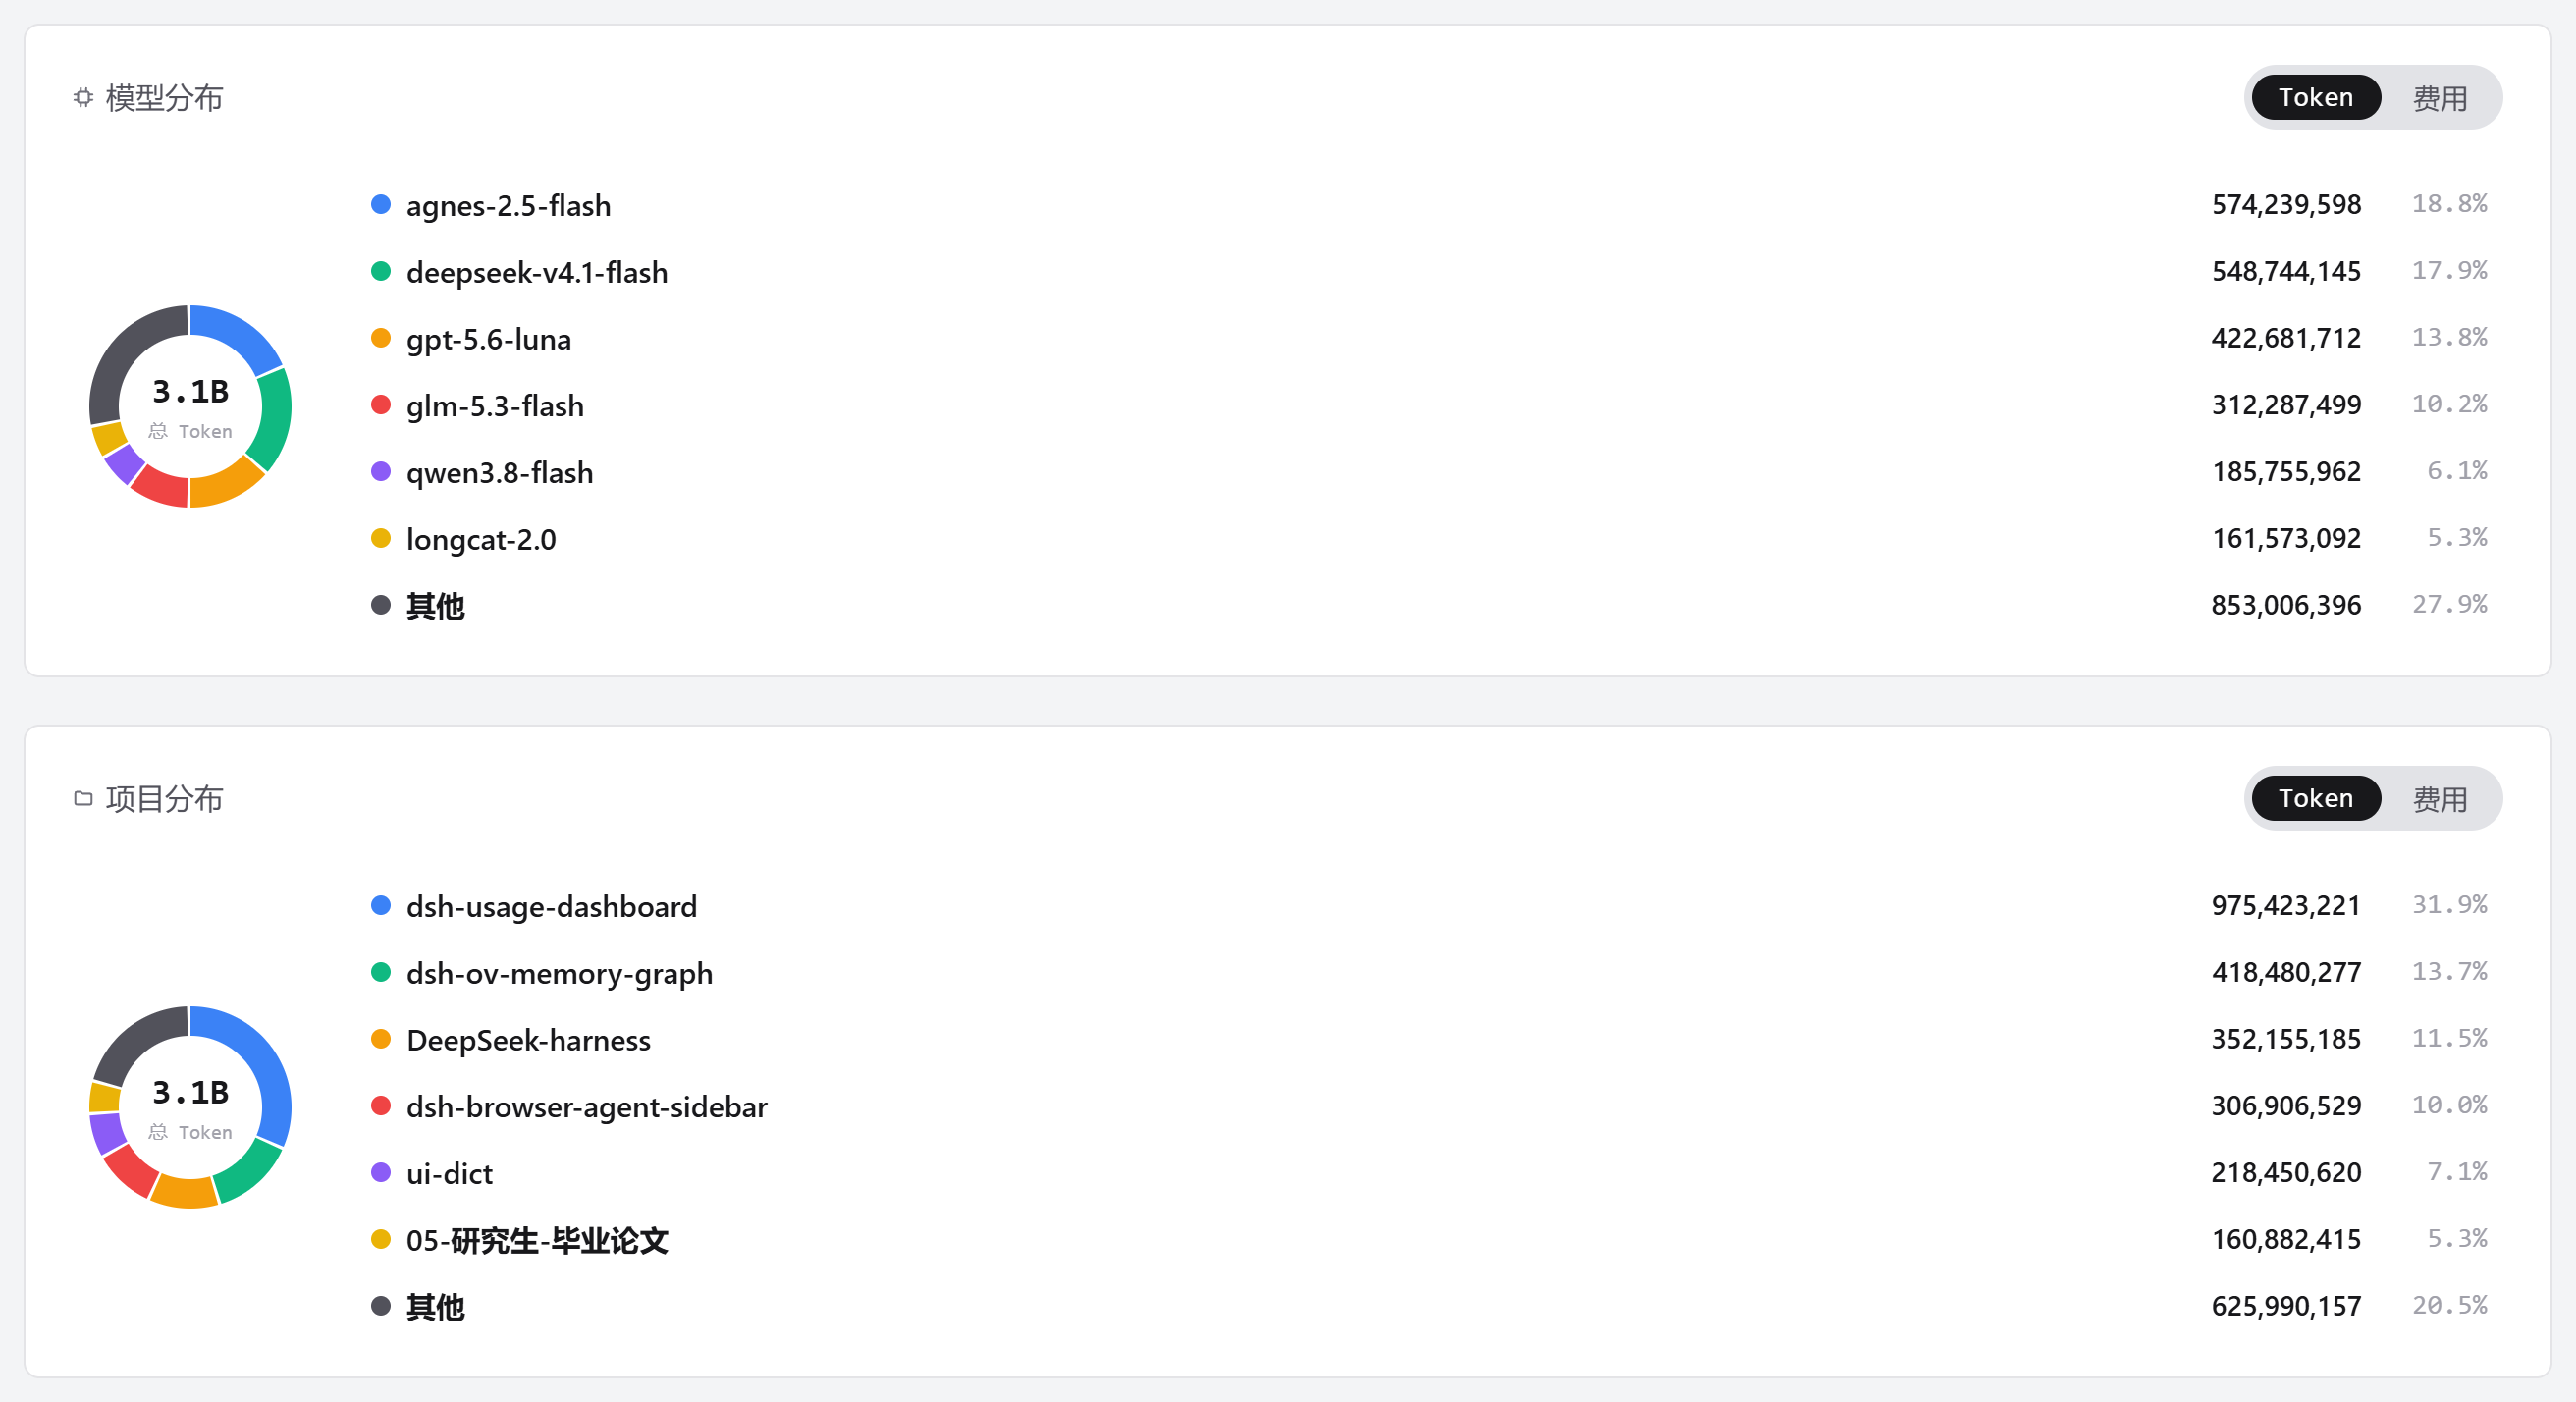
两张环形图分别从 Token(或费用)视角拆解用量:模型分布按模型拆分,项目分布按项目(基于会话 cwd 与 DSH workspace 归属)拆分。可在 Token / 费用间切换;占比前 6 项各有固定配色,其余聚合为「其他」,总量守恒。悬停图例项或扇区时,其余项与扇区变淡,圆环中心切换为当前项的 Token 与费用摘要。
活跃热力图(日历)
最近 40 周的 7 行 × 40 列 日历网格,单元格固定为正方形并带圆角;按每日 Token 量分 8 档着色(无 Token / ≥1M / ≥10M / ≥30M / ≥60M / ≥100M / ≥200M / ≥250M)。边缘日期的浮动 tooltip 自动限制在视口内。
Showing the opening section of the README — the full document lives in the repository以上为 README 开头摘要,完整文档在仓库内 · View the full README on GitHub →在 GitHub 查看完整 README →
Related相关推荐
-
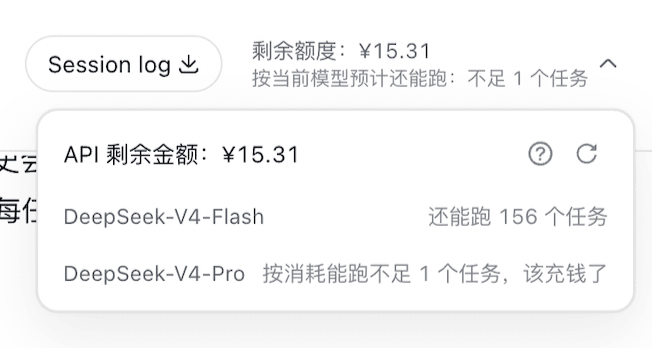 WilliamLIiii/DeepSeek-Harness-billing-plugin
DeepSeek Harness billing plugin: account balance + per-model remaining-task estimator with a session-header badge
WilliamLIiii/DeepSeek-Harness-billing-plugin
DeepSeek Harness billing plugin: account balance + per-model remaining-task estimator with a session-header badge
-
 dfkai/dsh-board
DeepSeek Harness 侧栏用量与成本面板:官方峰谷计价 · 1M 上下文 · 词勋段位 · 成就与热力图
dfkai/dsh-board
DeepSeek Harness 侧栏用量与成本面板:官方峰谷计价 · 1M 上下文 · 词勋段位 · 成就与热力图
-
 huanyuLv/dsh-balance-tide
DeepSeek Harness (DSH) Web 插件: 余额 + 峰谷计价潮汐提示。显示 DeepSeek 账户余额与本会话花费, 并在余额前提示当前峰/谷价格档位、距切换倒计时与使用建议。
huanyuLv/dsh-balance-tide
DeepSeek Harness (DSH) Web 插件: 余额 + 峰谷计价潮汐提示。显示 DeepSeek 账户余额与本会话花费, 并在余额前提示当前峰/谷价格档位、距切换倒计时与使用建议。
- future007s/dsh-peak-indicator 功能:会话头部显示一个徽标指示当前收费档期—— ⚡ 高峰(红色):当前按原价计费 🌙 闲时 · 半价(绿色):当前按半价计费 悬停显示:当前北京时间、时段说明、距离下次切换的倒计时;每 30 秒自动刷新
- KhalilYamber/dsh-tidewatch DeepSeek 峰谷时刻悬浮徽章 · dsh plugin:实时峰谷档位、下一阶段倒计时、本次会话 API 花费(含三段历史价格档)| A floating tide badge for DeepSeek Harness: live pe…
-
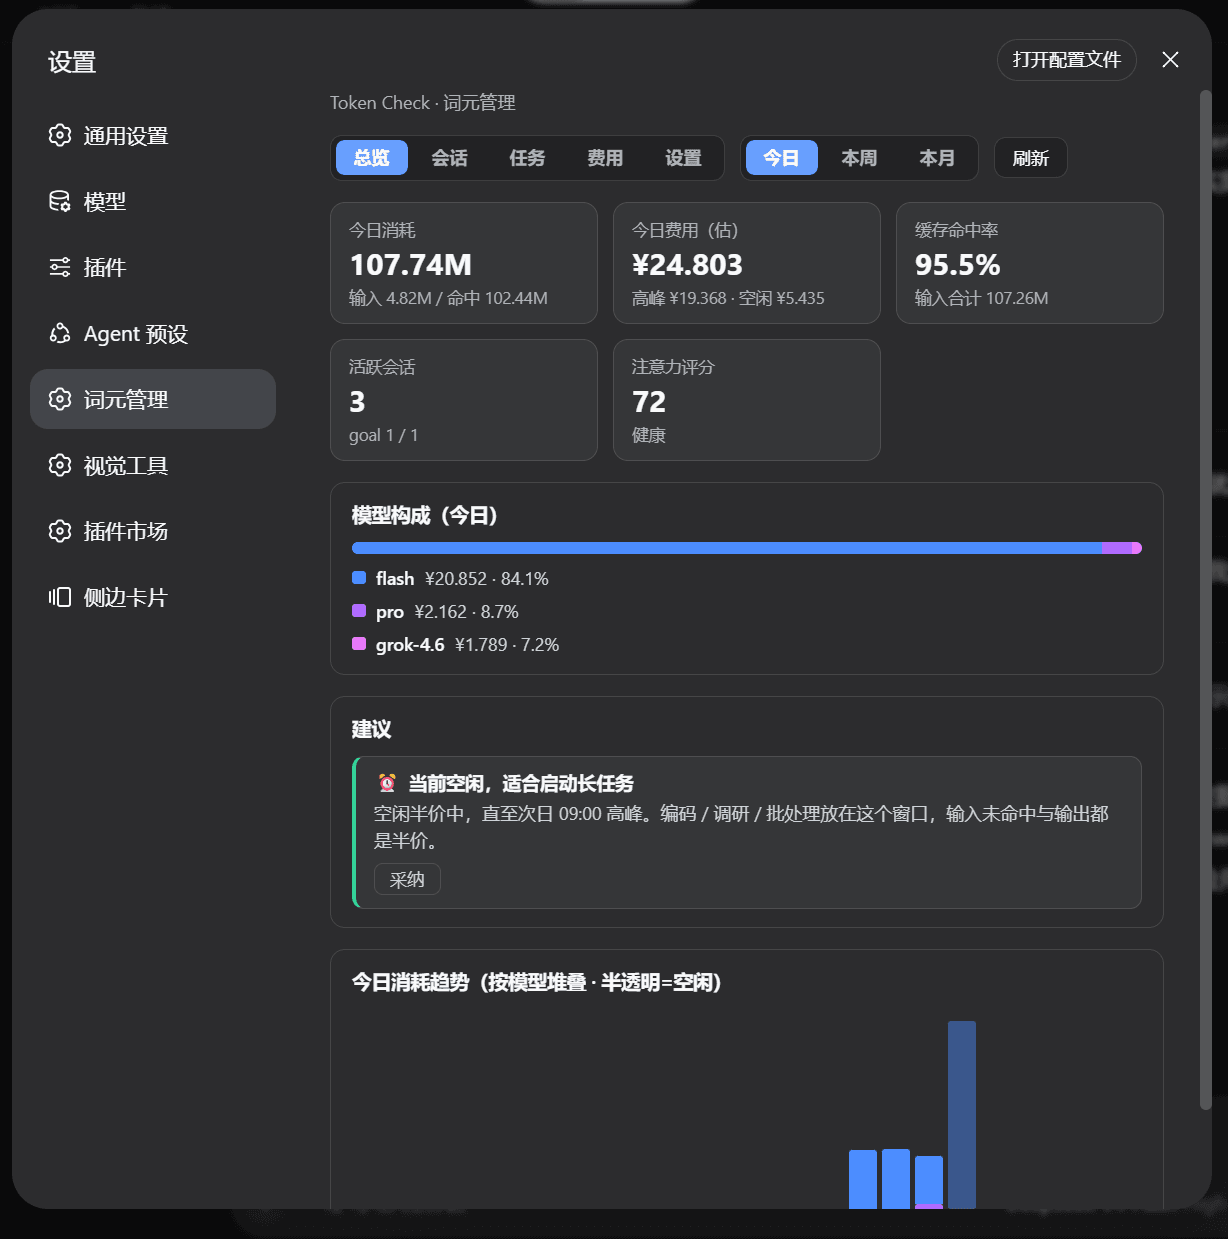 Young4ever33/dsh-token-attention
Token Check · 词元管理:DeepSeek Harness (DSH) 的 token 注意力管理面板——按任务/日/周/月记录 token 消耗与费用(命中/未命中/输出/推理),支持 DeepSeek 峰谷计价,并给出换对话…
Young4ever33/dsh-token-attention
Token Check · 词元管理:DeepSeek Harness (DSH) 的 token 注意力管理面板——按任务/日/周/月记录 token 消耗与费用(命中/未命中/输出/推理),支持 DeepSeek 峰谷计价,并给出换对话…
-
 Han-1413141/dsh-cost-meter
Cost tracking for DeepSeek Harness: session and model costs, token usage, budgets, provider balances, and coding-plan qu…
Han-1413141/dsh-cost-meter
Cost tracking for DeepSeek Harness: session and model costs, token usage, budgets, provider balances, and coding-plan qu…
-
 wssfk12138/dsh-damage-pulse
DeepSeek Harness Token 余额监控插件:鲸鱼娘待机/扣费/复苏动画、峰谷计费、连续扣费飘字与会话费用统计。
wssfk12138/dsh-damage-pulse
DeepSeek Harness Token 余额监控插件:鲸鱼娘待机/扣费/复苏动画、峰谷计费、连续扣费飘字与会话费用统计。