Enc-hanted/dsh-pulse
DeepSeek Harness Web 配置文件的跨会话使用与成本观测——趋势/热力图仪表盘、各模型高峰时段定价(人民币/美元)、官方 DeepSeek 余额与消费核对。
Project Overview项目介绍
dsh-pulse is a native DeepSeek Harness plugin that provides per-session usage and cost tracking for DSH users. You can install it directly via the DSH CLI by running dsh plugin --profile web add -w dsh-pulse, then restart DSH web to activate it. Once activated, you can access the dashboard via the sidebar button or the /pulse command, which never sends data to the model and does not consume any extra tokens. It pulls your existing DSH-stored DeepSeek API key to query official account balance, so no new secrets need to be configured.
The dashboard offers multiple views to track usage, including hourly charts for the current day, daily bar charts for up to 30 days, and a GitHub-style heatmap for up to one full year. You can filter data by project and model, view detailed session breakdowns with subagent attribution, and export any selected date range to a UTF-8 CSV file that opens directly in Excel. It also shows token distribution across models and ranks projects by total usage, and supports custom pricing rules for third-party models and providers, calculating costs based on DeepSeek’s official peak/off-peak tiered pricing by default.
This plugin is verified to work with @deepseek-ai/dsh 0.1.2-rc.1 on Windows with Node 24.14.1, and requires Node.js version 22.15 or higher to run properly. It is compatible with both legacy 0.1.0-rc.x and newer 0.1.2-rc versions of DSH, supporting both old and new DSH registration contract formats out of the box. It is released under the open source MIT license, stores all data locally, and never saves your API key, so it is safe to use for personal DSH setups.
这是一款专为 DeepSeek Harness 开发的原生插件,提供按会话统计的用量与成本观测功能。它聚合所有会话的 Token 使用量,根据内置的 DeepSeek 定价估算成本,还能展示官方平台的账户余额。所有功能都运行在 UI 层面,不会调用模型,也不会消耗额外的 Token 资源。
它支持多维度用量查看,包含按小时、日、月、年的不同趋势图表,还支持按项目和模型筛选统计范围。它支持查看会话明细、子代理用量归因,还提供一键 CSV 导出功能,允许用户自定义定价规则适配第三方服务商和模型,能根据 DeepSeek 官方的峰谷定价区分计算成本。
插件可通过 DSH 官方的插件命令直接安装,兼容 0.1.0-rc.x 和 0.1.2-rc 两个版本的 DSH 主程序,要求 Node 版本不低于 22.15。它采用 MIT 许可开源,不会存储用户密钥,所有数据都保留在本地主机,官方密钥只会用于查询余额,不会离开主机进程。
请帮我安装这个 DSH 插件。安装前先完成【兼容性检查 + 安全性检查】,检查通过再动手。

插件:dsh-pulse(Enc-hanted/dsh-pulse)
仓库:https://github.com/Enc-hanted/dsh-pulse
本站详情页:https://www.yhbd.top/plugins/enc-hanted-dsh-pulse/
本站登记:类型 plugin · 归类 原生 DSH 插件 · 许可证 MIT · ⭐ 3 · 最近提交 2026-09-24 · 主语言 JavaScript

按下面顺序执行,每步先把结论告诉我,再进入下一步:

【1 兼容性检查】
① 我这边:DSH 版本、Node 版本、操作系统、当前 profile(web / desktop)。
② 读它的 README、package.json、插件 manifest,列出它要求的 DSH 版本 / Node 版本 / 操作系统 / 外部依赖 / 需要另外先装的运行时。
③ 逐条比对,结论只写「满足 / 不满足 / 未知」三种;不满足的给出可行替代方案。
④ 检查是否和我已装的插件冲突:命令名重复、skill / tool 重名、端口占用、重复注册的 MCP server。

【2 安全性检查】
① 仓库可信度:和上面「本站登记」是否一致;star / fork 数、创建时间、最近提交,是否归档或长期停更。
② 安装脚本:逐行看 package.json 的 preinstall / install / postinstall,以及 install.sh、setup.ps1 之类脚本。出现 curl|bash、下载后直接执行、混淆代码、访问与插件功能无关的域名,立刻停下来告诉我,不要继续装。
③ 依赖:列出新增依赖,标出无人维护、或与知名包拼写近似的可疑包(typosquatting)。
④ 权限与副作用:它会读写哪些目录、访问哪些域名、需要哪些 DSH 权限(filesystem / network / shell / clipboard 等),以及怎么卸载和回滚。
⑤ 如果它要求 sudo / 管理员权限,或权限明显超出功能所需,先停下来问我。

【3 安装】
上面两步没有「不满足」和「高危项」时才执行;用官方推荐方式安装,不要自行提权。

【4 汇报】
用表格输出:检查项 / 结论 / 依据 / 是否需要我决策。拿不准的一律写「未知」并说明要我怎么确认——不要猜,也不要替我决定。
Send this message to DSH in your current session: it verifies compatibility and security first (answering met / not met / unknown item by item) and only installs once everything checks out — it will stop and ask you if it finds a high-risk item. The box scrolls; the copy is the full prompt. CLI install commands may not be accurate across systems, so DSH is the safer route.把上面这条消息直接发给当前会话里的 DSH:它会先核对兼容性与安全性(逐条给「满足 / 不满足 / 未知」),确认没问题再安装,有高危项会停下来问你。框内可滚动,复制到的是完整提示词;安装命令不一定准确,发给 DSH 更稳。
- Only 3 stars - very few users, little community feedback星标只有 3,几乎没人在用,遇到问题缺少社区反馈
DSH walks through these 9 checksDSH 会逐条核对这 9 项
Compatibility兼容性
- DSH, Node, OS and profile requirementsDSH 版本 / Node 版本 / 操作系统 / profile 是否满足要求
- External dependencies and runtimes (Electron / Python / Docker, ...)外部依赖与运行时(Electron / Python / Docker 等)是否齐备
- Conflicts with installed plugins: command names, skill / tool names, ports, duplicate MCP registration与已装插件是否冲突:命令名、skill / tool 重名、端口占用、重复 MCP 注册
Security安全性
- Repo matches the facts registered here; archived or abandoned?仓库是否与页面登记一致,是否归档或长期停更
- Safety of preinstall / install / postinstall and install.sh / setup.ps1preinstall / install / postinstall 与 install.sh、setup.ps1 是否安全
- curl|bash, download-then-execute, obfuscation, unrelated domains → stop immediatelycurl|bash、下载即执行、混淆代码、无关域名 → 立刻停止
- Typosquatting or unmaintained packages among the new dependencies新增依赖里有没有 typosquatting 或无人维护的包
- Requested permissions vs. what the feature actually needs申请了哪些权限、是否超出功能所需(filesystem / network / shell / clipboard)
- Any sudo / admin requirement, plus uninstall and rollback是否要求 sudo / 管理员权限,以及卸载与回滚方式
Anything uncertain must be marked unknown with a note on how to confirm it. This site's signal screen is a static snapshot, not a security audit.拿不准的必须标「未知」并说明要我怎么确认。本站的信号筛查是静态快照,不能替代安全审计。
Or use CLI install (for developers)或使用命令行安装(适合开发者)
CLI Install命令行安装
dsh plugin --profile web add -w dsh-pulse把 Enc-hanted/dsh-pulse 加入你的 DSH 配置(web profile)即可启用。
READMEREADME
dsh-pulse
English | 简体中文
Per-session usage and cost observatory for dsh. Aggregates token usage across all sessions, estimates cost from built-in DeepSeek rates, and shows the official platform balance. Everything runs on the UI plane: no model-visible tools, zero tokens spent.
Features
- Panel structure: the two first-row KPI cards (cache-ring gauge, cost sparkline) are the view tabs — click the ring for the usage trend, click the cost card for the cost trend; the grip in the card row's bottom-right corner resizes that row's height only, double-click restores it, and the preference stays browser-local
- Usage trend: hourly line chart for today, daily bars for 7/30 days, GitHub-style heatmap for 90 days/1 year, custom date ranges up to 30 days. The bar chart drills two levels: click a day to sweep that day full width by model, click a model for its input/cache/output token split, then click empty space or press Esc to unwind one level at a time
- Project / model filters: two searchable dropdowns restrict the whole dashboard to one workspace and/or one model
- Cross-provider model distinction: models are labeled as
provider · display namefrom the Models config; the provider prefix appears only when several providers serve the same-named model, otherwise just the name. Selecting a third-party (non-official) model hides the official balance; an unpriced third-party model also hides the cost estimate and the monthly budget - Model distribution / project ranking: share bars and a ranked table
- Session detail & subagent attribution: sessions grouped by project, with a subagent subtotal (count / tokens / cost) and every session's own break analysis — expand a session, click its cumulative-consumption curve to place up to three breaks, and read per-segment tokens and cost at second accuracy (a task's research / thinking / summary stages)
- Cost estimate: per-model rates priced by the official tier schedule, including the off-peak/peak epochs from 2025-08-17; models without a rule are listed as unpriced
- Cost trend: daily sparkline, with the official balance reconciliation line overlaid after a day of snapshots
- Status bar: official balance, runway in days, window activity (sessions / turns / tool calls) and the update clock, queried with the key the host already stores and refreshable by hand; clicking it expands the merged cost-estimate + monthly-budget panel
- CSV export: one click in the dashboard header downloads the loaded window as a UTF-8 CSV daily table — tokens, cache-hit rate, tier-aware cost and official spend per day, plus a totals row (opens directly in Excel)
- Panel-relative sizing: card and plot heights derive from the panel's own width (
aspect-ratioplus min/max bounds), so they never follow the browser window; themes cover light / dark / pink / orange with a custom accent, and the build stamp beside the title (0.5.0) tells you which revision is rendering
Showing the opening section of the README — the full document lives in the repository以上为 README 开头摘要,完整文档在仓库内 · View the full README on GitHub →在 GitHub 查看完整 README →
Related相关推荐
-
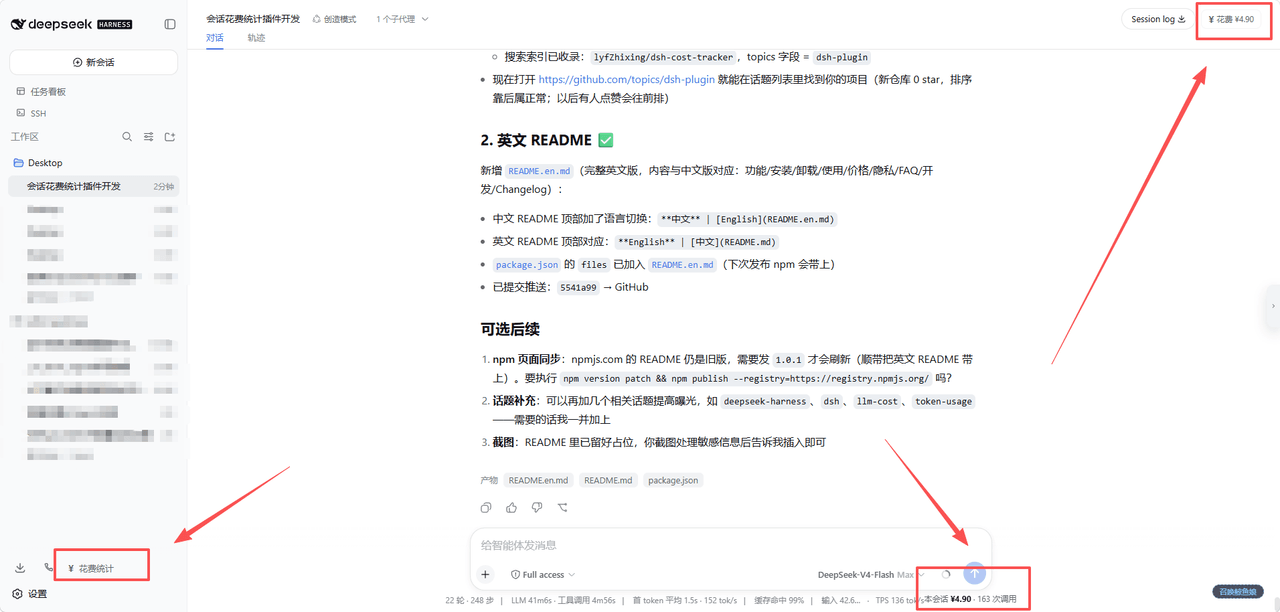 lyfZhixing/dsh-cost-tracker
为 DeepSeek Harness Web(`dsh --profile web`)记录**每日 LLM 调用花费**,支持按会话 / 模型 / 天多维度查看。
lyfZhixing/dsh-cost-tracker
为 DeepSeek Harness Web(`dsh --profile web`)记录**每日 LLM 调用花费**,支持按会话 / 模型 / 天多维度查看。
-
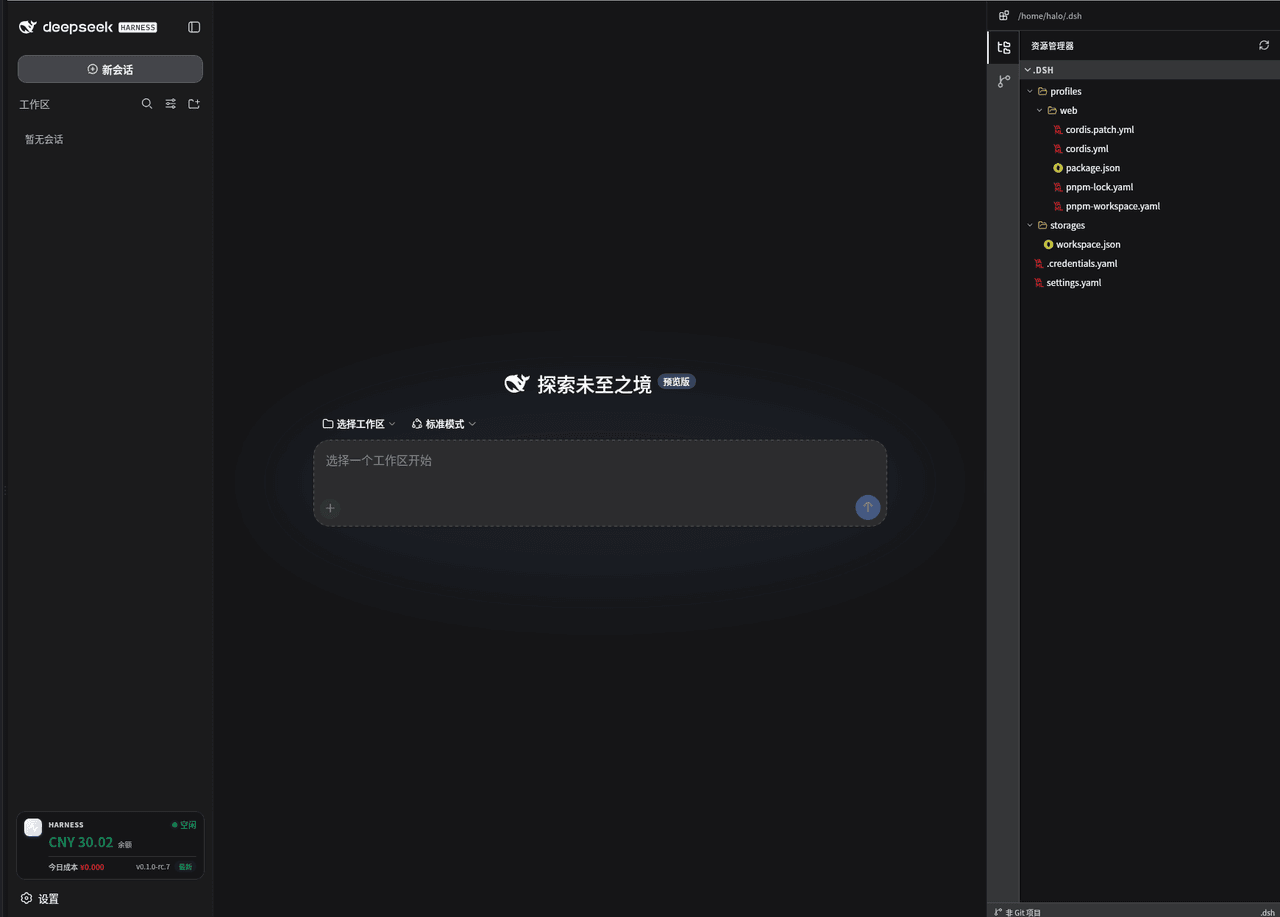 deepseek-dsh/dsh-workspace
DeepSeek Harness Web UI 增强插件:余额用量概览、项目文件浏览、Git 变更与历史、内置终端、Harness 更新检查
deepseek-dsh/dsh-workspace
DeepSeek Harness Web UI 增强插件:余额用量概览、项目文件浏览、Git 变更与历史、内置终端、Harness 更新检查
-
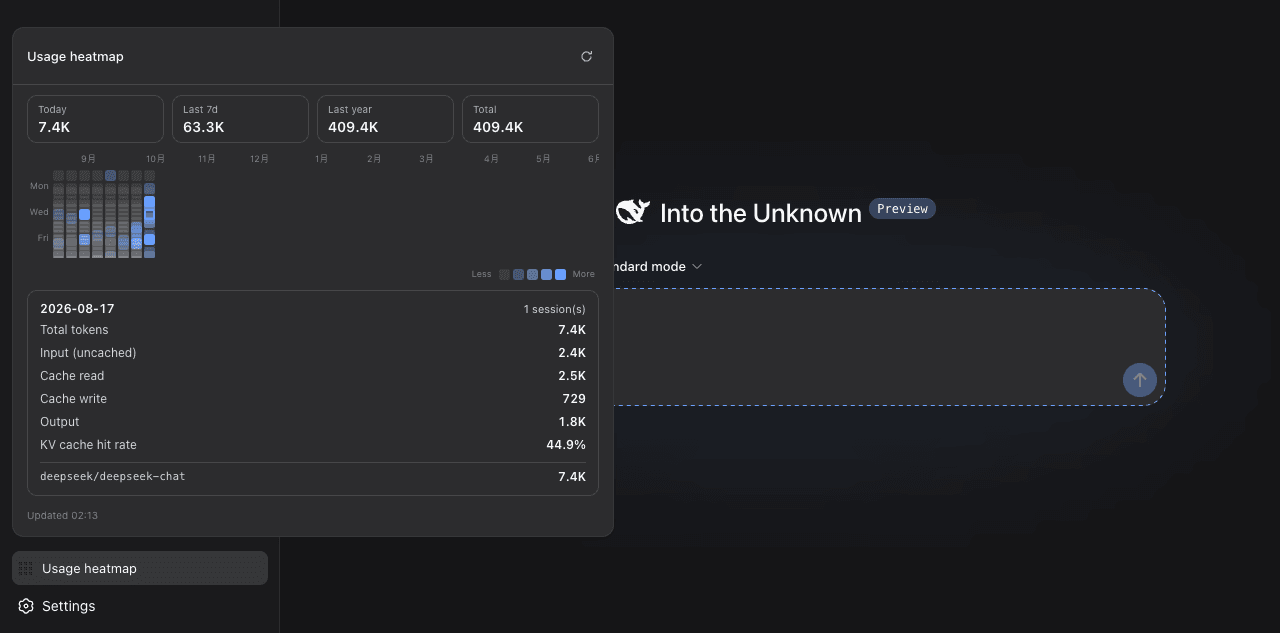 helloxkk/dsh-scope
Context visibility + GitHub-style usage heatmap for DeepSeek Harness (dsh) — Codex-style /context lens + 53-week contrib…
helloxkk/dsh-scope
Context visibility + GitHub-style usage heatmap for DeepSeek Harness (dsh) — Codex-style /context lens + 53-week contrib…
-
 edison7009/EchoBird
Manage ChatGPT, Codex CLI, and Claude Code accounts and track quota in one place. Use multi-model smart routing with pri…
edison7009/EchoBird
Manage ChatGPT, Codex CLI, and Claude Code accounts and track quota in one place. Use multi-model smart routing with pri…
-
 Han-1413141/dsh-cost-meter
Cost tracking for DeepSeek Harness: session and model costs, token usage, budgets, provider balances, and coding-plan qu…
Han-1413141/dsh-cost-meter
Cost tracking for DeepSeek Harness: session and model costs, token usage, budgets, provider balances, and coding-plan qu…
-
 wssfk12138/dsh-damage-pulse
DeepSeek Harness Token 余额监控插件:鲸鱼娘待机/扣费/复苏动画、峰谷计费、连续扣费飘字与会话费用统计。
wssfk12138/dsh-damage-pulse
DeepSeek Harness Token 余额监控插件:鲸鱼娘待机/扣费/复苏动画、峰谷计费、连续扣费飘字与会话费用统计。
-
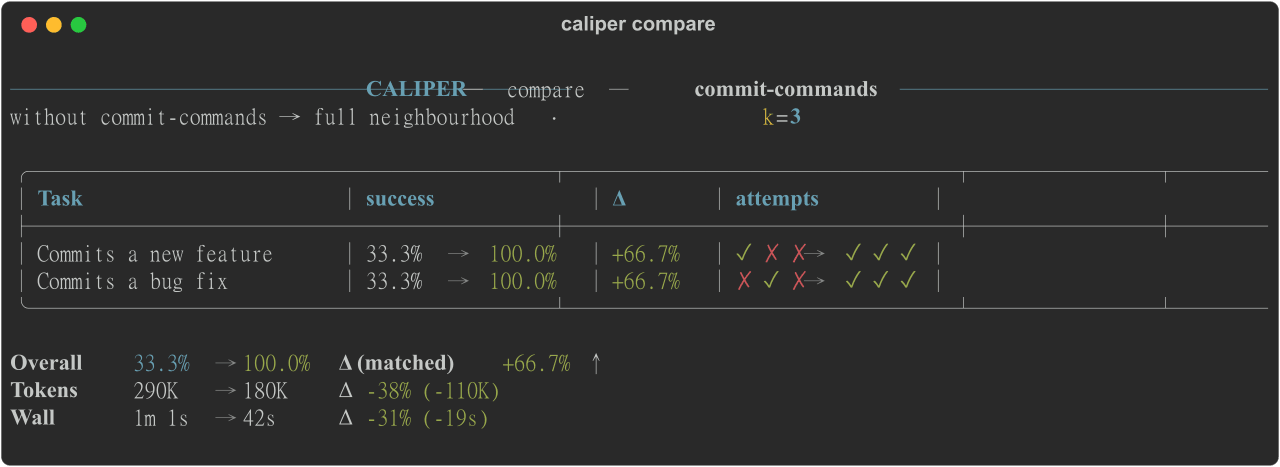 edonadei/caliper
Run your real agent with and without your skills, MCPs, and rules. See which ones actually help, and what they cost in t…
edonadei/caliper
Run your real agent with and without your skills, MCPs, and rules. See which ones actually help, and what they cost in t…
-
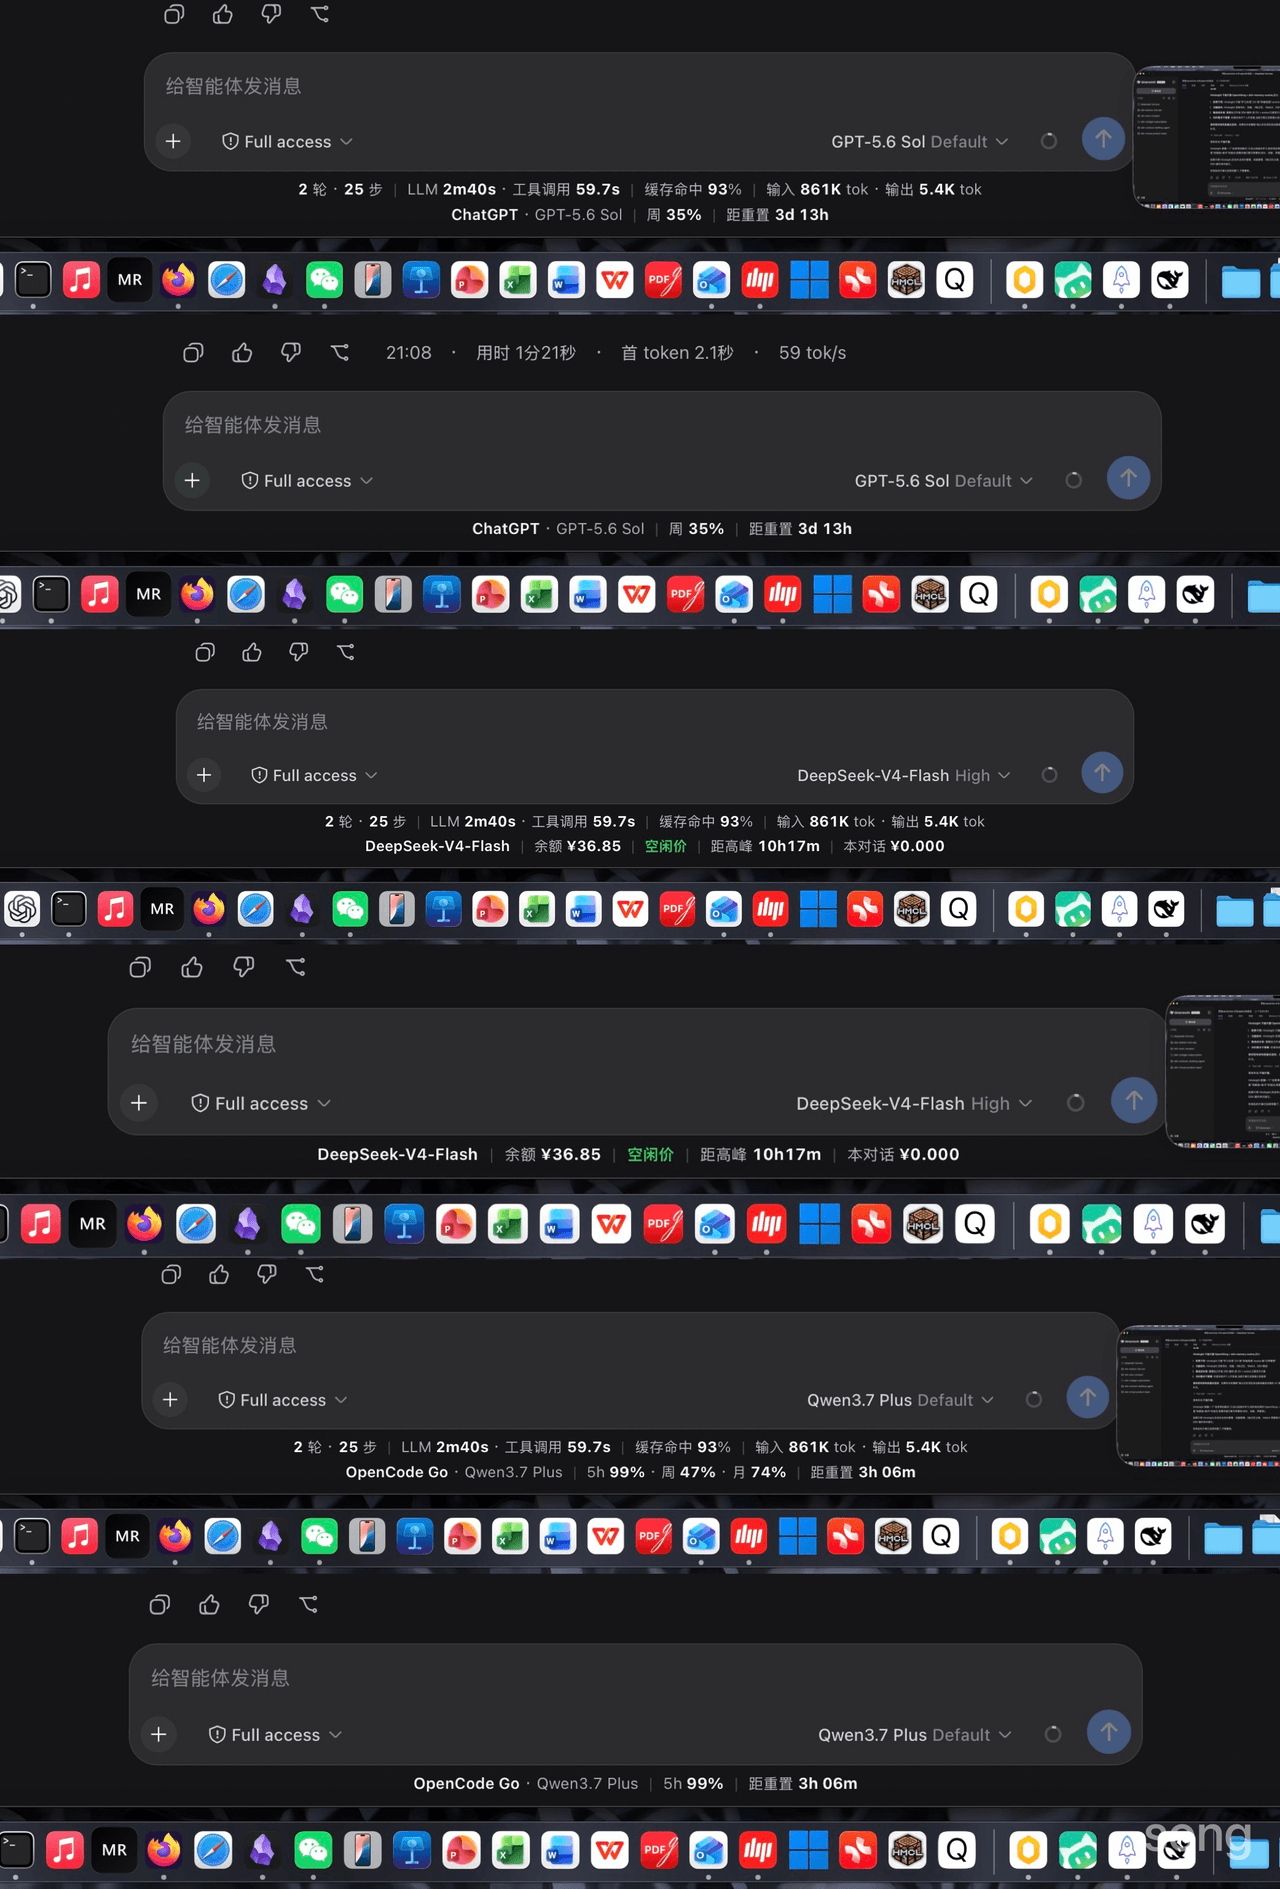 songoao25/dsh-bottom-info-bar
DeepSeek Harness (DSH) plugin: replaces the stats row under the composer with provider and model, balance or subscriptio…
songoao25/dsh-bottom-info-bar
DeepSeek Harness (DSH) plugin: replaces the stats row under the composer with provider and model, balance or subscriptio…