VviLliAm-qwq/dsh-peak-balance
Peak/off-peak billing clock with live DeepSeek balance and per-turn cost above the dsh-tui prompt, plus an optional flashing peak-hour warning frame.
Project Overview项目介绍
This is a cost and balance tracking plugin for DeepSeek Harness (DSH) TUI. It tracks peak/off-peak DeepSeek billing, displays live account balance, per-turn cost, and provides a GitHub-style token usage history grid. Use it when you need to monitor token usage and spending on DeepSeek via DSH TUI. Note narrow terminals may truncate the status line tail.
这是DeepSeek Harness TUI的峰谷计费余额追踪插件,支持显示峰谷时段计费时钟、实时账户余额、单轮对话成本,还可查看GitHub风格的token使用历史网格。适合在DSH TUI使用DeepSeek时监控费用与token消耗,注意窄终端可能截断状态栏末尾内容。
请帮我了解并安装插件:【dsh-peak-balance】【https://github.com/VviLliAm-qwq/dsh-peak-balance】Send this message to DSH in your current session. CLI install commands may not be accurate across systems — DSH will figure it out for you.把上面这条消息直接发给当前会话里的 DSH,让它帮你了解并安装。安装命令不一定准确,发给 DSH 更稳。
Or use CLI install (for developers)或使用命令行安装(适合开发者)
CLI Install命令行安装
dsh plugin --profile dsh-tui add dsh-peak-balance把 VviLliAm-qwq/dsh-peak-balance 加入你的 DSH 配置(web profile)即可启用。
READMEREADME
dsh-peak-balance

English · 中文
Peak/off-peak billing clock, live DeepSeek account balance, per-turn cost and a
/hist token-history grid — inside
dsh-TUI.
⚡ 峰时 09:00-12:00 · 距谷时 1h23m · 本轮 ¥0.0234 · 余额 ¥42.10
(The order is phase → countdown → turn → balance: a narrow terminal truncates
the tail, and the per-turn cost is the figure that changes while you watch. While
the model is still answering, the turn figure is live — rendered as
本轮·计费中 ¥… and refreshed on every usage report — and it freezes to
本轮 ¥… once the turn closes.)
While the peak window is active you can turn the line into a three-row frame that pulses in one of seven colors:
╭──────────────────────────────────────────────────────────╮
│ ⚡ 峰时 · 距谷时 1h23m · 本轮 ¥0.0234 · 余额 ¥42.10   ▂▃▄▅▆▇ │
╰──────────────────────────────────────────────────────────╯
/hist (also /tokenhistory, alt+h, or /th with a trailing space — see
below) takes over the whole terminal with a GitHub-style contribution grid:
╭─ 🐋 Token history  Total tokens  26w  subagents counted ───────────────── ✕ ─╮
│ updated 12:04:11 · 341 sessions · 6,706 reports · 9 active days               │
│ ───────────────────────────────────────────────────────────────────────────── │
│      6月      7月      8月      9月                                           │
│ Mon  ▢▢▢▢▢▢▢▢▢▢▢▢▢▢▢▢▢▢▢▢▢▢▢▢▢▢                                               │
│ Wed  ▢▢▢▢▢▢▢▢▢▢▢▢▢▢▢▢▢▢▢▢▢▢▢▢▢▢                                               │
│ Fri  ▢▢▢▢▢▢▢▢▢▢▢▢▢▢▢▢▢▢▢▢▢▢▢▢▢▢                                               │
│                       ▲                                                       │
│ Total tokens less ▢▢▢▢▢ more · peak 251,442,584                               │
  ╭─ 2026-09-11 Fri ───────────────────────────────────────────────────────╮
  │ tokens      input(miss) 2,065,340 · cache read 224.3M · output 1.5M       │
  │ cost        ¥18.8494                                                      │
  │ cache hit   99.1% · subagent share 12.4%                                  │
  │ model       deepseek-flash 227.9M · deepseek-v4-pro 3.2M                  │
  ╰───────────────────────────────────────────────────────────────────────────╯
│ Total       1,079,834,040 · Est. cost ¥64.6867 · cache hit 99.0%              │
│ subagents   36/341 sessions · 945 reports · busiest 2026-09-11                │
│ ───────────────────────────────────────────────────────────────────────────── │
│ model                              tokens   cost(est) hit rate    rates       │
│ ───────────────────────────────────────────────────────────────────────────── │
│ deepseek-flash                     587.3M      ¥33.94    99.3% built-in       │
│ deepseek-v4-flash-vision-exp       412.6M      ¥24.53    98.8% built-in       │
│ deepseek-v4.1-flash-expires…        68.2M           —    98.5%  unknown       │
│ deepseek-v4-pro                      8.0M       ¥4.28    95.4% built-in       │
│ deepseek-v4-flash                  457.2k     ¥0.0975    90.1% built-in       │
│ ←/→ week · ↑/↓ day · t today · m metric · w span · s subagents · r rescan · q/Esc close │
╰───────────────────────────────────────────────────────────────────────────────╯
Features
| Feature | What it shows |
|---|---|
| Peak / off-peak clock | The billing window currently in force and a live countdown to the next price switch (09:00-12:00 / 14:00-18:00 Beijing time, Monday–Friday; weekends are off-peak all day). |
| Account readout (provider-neutral) | The balance or plan quota of the provider the focused conversation actually runs through: an official balance, a subscription's 5-hour/weekly/monthly windows, a relay's credit pool. The provider comes from request/header.config.provider in the session log, and its base URL and credential reference are resolved through the harness seams. A conversation restored at boot names no route until its first request (the host replays its history without re-emitting events), so auto follows the host's persisted /model route — the one the next request will use — until the conversation speaks for itself. A provider with no readable interface is simply left off the line — no figure is ever guessed. |
| Per-turn cost | What the turn that just finished cost. When the provider exposes a spend counter (Command Code credits, OpenRouter key usage, a relay's used quota) this is measured from that counter; otherwise it is estimated from a rate card, and otherwise the line says the model is unrated. The figure follows the conversation you are focused on, not the one that last appended an event. |
Quota diagnostics /quota |
One command shows what is being read, which adapter answers, why the last read failed, and every provider route this process could ask about (/quota check <provider> probes one on the spot). |
| Peak-hour warning | Optional. While peak pricing is active the status contribution becomes a rounded frame whose border, phase label and travelling waveform pulse in the chosen color. |
History grid /th |
A full-screen scene: one square per day, shaded by that day's usage, with a hover card for the day under the pointer. Keyboard: ←/→ walks days, ↑/↓ walks weeks, m cycles the metric, w the span, s the subagent switch, r rescans, q/Esc returns to the conversation. |
| Totals and per-model stats | Totals: tokens, estimated cost, cache-hit rate, active days, sessions, subagent share, busiest day. Model table: each model's total tokens, estimated cost, cache-hit rate and where its rates came from. The totals row covers all history (it does not follow the grid's span) and says so inline. |
Custom rates /th price |
Price a model the embedded card does not list; until you do, it reports tokens with an explicit "unrated" marker instead of a guessed amount. |
| Follows the UI language | Instant hand-off with dsh-TUI's /lang: the status line, the history scene and every command reply switch with it. The host mirrors the choice into its dsh-tui settings namespace and the plugin listens for settings/updated; a 1 s poll of ~/.dsh-tui/lang.json covers hosts that serve no such namespace. The settings card and the command-completion descriptions were already bilingual. |
| Settings subpage | The Peak & Balance card gains a Token history subpage with ten options. |
Install
# from npm
dsh plugin --profile dsh-tui add dsh-peak-balance

# ...or straight from a checkout of this repository (pnpm packs the local
# directory, so the profile keeps a real copy instead of a symlink)
dsh plugin --profile dsh-tui add file:/absolute/path/to/dsh-peak-balance
The command appends the bundle row to the profile's dsh.profile.bundles.
Then restart the TUI (/restart inside dsh-tui) so the profile loads the new
row; the settings card appears under /settings immediately after the restart.
Installing by symlink (
link:or a directory junction) is not recommended: Node resolves a plugin's real path, and@deepseek-ai/*must stay reachable from it.file:and npm installs both leave a real directory inside the profile, which is the layout the host expects.Updating a
file:install: pnpm caches a local directory dependency, soadd/updatealone will not pick up edited sources. Remove and re-add it (after a version bump) to refresh the profile copy:dsh plugin --profile dsh-tui remove dsh-peak-balance dsh plugin --profile dsh-tui add file:/absolute/path/to/dsh-peak-balance
Settings
/settings → the Peak & Balance card. Edits are written live; no restart is
needed.
Main card:
| Field | Type | Default | Meaning |
|---|---|---|---|
| Show balance | boolean | true |
Show the account section on the status line (the provider's quota meter, as an amount or a percentage). |
| Show per-turn cost | boolean | true |
Show what this turn has cost: a live estimate while the model answers, frozen when the turn closes (measured from the provider's counter when it has one). |
| Peak-hour warning | boolean | false |
Turn the line into a pulsing frame while peak pricing is active. |
| Warning color | select | red |
Frame color: red orange yellow green cyan blue purple. |
Provider quota subpage:
| Field | Type | Default | Meaning |
|---|---|---|---|
| Quota provider | text | auto |
auto follows the focused conversation's provider, falling back to the host's persisted /model route while a restored conversation has not sent its first request; a provider id (commandcode, openrouter, …) pins that one; off hides the account section. |
| Quota metric | select | auto |
auto (the tightest window), balance, window5h, windowWeekly, windowDaily, windowMonthly, planRemaining, keyLimit, periodSpend, lifetimeSpend, or rotate (cycle every meter, one every 8 s). |
| Turn spend | select | auto |
auto (measured when the provider has a counter), measured, estimate. |
| Unofficial endpoints | boolean | false |
Allow quota reads from endpoints no provider documents publicly (mostly reverse-engineered console APIs). |
| Provider spec file | text | empty | JSON file describing providers this build ships no adapter for; empty uses ~/.dsh-tui/dsh-peak-balance-providers.json. |
| Billing mode | select | auto |
How the account readout is shaped: auto follows the provider's declaration (a subscription shows percentages, pay-as-you-go shows amounts), or force money / plan. |
| Percentage base | select | meter |
What a plan percentage divides by: meter uses the window the line is showing, monthly the whole monthly pool. |
Token history subpage:
| Field | Type | Default | Meaning |
|---|---|---|---|
| Grid metric | select | tokens |
What the squares shade: tokens, cost, output, cacheMiss. |
| Time span | select | 26 |
Week columns drawn: 13 / 26 / 53. |
| Count subagents | boolean | true |
Subagent sessions spend real tokens; off reports only your own conversations. |
| Week starts on | select | mon |
Which weekday is the grid's first row (mon / sun). |
| Grid palette | select | github |
github (green), blue, or theme (the active accent). |
| Scene layout | select | card |
card frames the scene in a rounded box with section separators; plain drops the chrome (2 rows / 4 columns cheaper). Card falls back to plain by itself on a small terminal. |
| Hover: tokens | boolean | true |
Show the input / cache-read / output split in the day card. |
| Hover: cost | boolean | true |
Show the hovered day's estimated cost. |
| Hover: cache hit rate | boolean | true |
Show the hovered day's cache-hit rate. |
| Hover: models | boolean | true |
Show which models the hovered day used. |
The settings live in the dsh-peak-balance namespace of the dsh settings
document, so they can also be edited there directly. The scene's m / w / s
keys are settings changes: they write back immediately (and survive a restart);
if the write is refused the change stays for the current session and a warning is
logged.
/hist — token history
/hist                                 # open the grid (recommended: no built-in collision)
/tokenhistory                         # the long alias
alt+h                                 # same thing without typing
/th                                   # works too, but keep the trailing space (see below)
/hist price                           # list custom rates and unrated models
/hist price set <model> <hit> <miss> <out> [peakHit peakMiss peakOut]
/hist price rm <model>
/hist price clear
/quota                                # quota diagnostics: source, adapter, meter, last failure
/quota check <provider>               # probe one provider now (empty = the current target)
/quota meter windowWeekly             # switch the status-line meter (same as the setting)
Why a bare /th + Enter switches the theme
A host behaviour the plugin cannot change, stated plainly: while dsh-tui's
slash-completion overlay is open, Enter runs the highlighted suggestion, not
the line you typed (handleEnter in PromptInput.js); the merged list puts
built-ins first and appends plugin commands, and the selection resets to the
first row. Typing /th matches theme, thinking and our th, so the
highlight sits on theme and Enter switches the theme.
| Entry point | Note |
|---|---|
/hist |
Recommended. hist is not a prefix of any built-in, so the menu offers only it and Enter runs it. |
/tokenhistory |
Same, no collision. |
alt+h |
Opens the scene straight from the chat state. |
/th + Enter |
Keep the trailing space: the menu closes (no children), and Enter dispatches th. |
A future SKILL whose name starts with
histwould capture/hist's Enter the same way — same host logic; rename then (it is one constant in the code).
Keyboard
| Key | Effect |
|---|---|
← / → |
Move to the square to the left/right (same weekday, one week) |
↑ / ↓ |
Move to the square above/below (same column, one day) |
t |
Jump back to today |
m / w / s |
Cycle metric / span / subagents (the matching chip flashes; the change is persisted) |
r |
Rescan |
q / Esc |
Back to the conversation |
Moves stop at the grid edge and never enter a day that has not happened yet (no
wrapping). The selected square is lightened and a ▲ under the grid points at its
column.
Subagent feedback: the title bar carries a permanent chip (subagent counted
— green — or subagent excluded), pressing s inverts it for 1.2 s, and the
totals row spells out excluded N sessions / M reports instead of just shrinking
the numbers.
The data source is this machine's session logs ($DSH_HOME/sessions/). Every
assistant/message event in those logs carries the usage DeepSeek returned for
that request (inputTokens / cacheReadTokens / outputTokens /
cacheWriteTokens); the plugin files each report into the Beijing calendar day
and the peak/off-peak tier of its own timestamp, then per model. So:
- tokens are the provider's own reported numbers, not a local estimate;
- money is an estimate (the API returns tokens, never money), converted with the embedded rate card or your custom rates, and labelled as such;
- only this machine's dsh usage is covered — web chat or other clients are not;
- the covered range is whatever this machine's logs still hold.
Subagents count by default (they spend real money), stay distinguishable, and can be switched off.
Unrated models (not on the embedded card) show tokens with — for money
until you give them rates through /hist price set. Custom rates are written
immediately to ~/.dsh-tui/dsh-peak-balance-rates.json and feed both the history
view and the status line's per-turn figure. <hit> <miss> <out> are the
off-peak prices in CNY per million tokens; peak defaults to twice those (the
official rule), and you can pass three more numbers to set the peak tier
explicitly.
Two implementation details that decide the accuracy (both reproducible on real logs):
- The logs are multi-frame zstd (one frame per append).
zlib.zstdDecompressSyncstops after the first frame, and scanning for the magic bytes can hit the magic inside a compressed block — where a truncated decode still "succeeds" with partial content and silently drops events. The plugin parses the zstd frame and block headers to compute each frame's exact length: on this machine's 341 logs the byte-scanning approach lost 282 events, the header walk recovers all of them. - Fork/rewind logs physically carry their parent's event prefix. The cut is
the header's
seedLength(the firstsession/end-seedevent sits on it); without it a naive sum counts the parent's usage twice — 292 usage reports (~4.5%) across this machine's nine seeded logs.
Cache. Activation reads the incremental cache and paints the grid from it, so
opening the scene is instant; the scan that follows only refreshes what changed.
The cache is incremental three ways: a log whose (path, size, mtime) is
unchanged is skipped outright; a log that was only appended to is finished
from the frame the cache stopped at (a done offset, guarded by a 16-byte
signature of the bytes just before it), so only the new frames are decompressed;
and a cache written by an older version is migrated in place rather than
thrown away. Measured on this machine (437 logs, 112 MB, 190k frames): after the
largest log grows, a rescan fell from 314 ms to 17 ms, and the first scan after
a plugin update fell from a full rebuild to 81 ms. An up-to-date corpus lands in
20–30 ms. The cache lives at ~/.dsh-tui/dsh-peak-balance-history.json (safe to
delete — it rebuilds). The one genuinely slow case is that first rebuild on a
large corpus (≈ 5–6 s here, of which ≈ 4.3 s is decompressing 190k small zstd
frames one at a time — a Node-side floor); it checkpoints as it goes so an
interrupted run resumes instead of starting over, and it paints as it goes,
newest logs first, so the recent weeks are on screen within the first second.
While the scene is open it re-scans once a minute behind the figures (the status
line shows refreshing); closing it stops that.
How the numbers are produced
Peak window. Off-peak pricing is half of peak pricing; peak hours are
Beijing time (UTC+8) Monday–Friday 09:00-12:00 and 14:00-18:00, everything
else — including both weekend days — is off-peak.
Cost. DeepSeek's API returns token counts, never money, so the per-turn figure is an estimate:
cost = inputMissTokens   × inputMissRate
     + cacheReadTokens   × inputHitRate
     + outputTokens      × outputRate
The three input-side figures are disjoint: inputTokens is the prompt that
missed the cache, cacheReadTokens is the prompt served from cache, and the
provider's own totalTokens is their sum plus the output. Treating the cache
read as a subset of the input (clamping one against the other) under-prices a
cached turn by several times — measured against a real balance drop on
2026-09-10, a turn that cost ¥0.20 was estimated at ¥0.03 that way and ¥0.23
with the formula above.
Each provider usage report is filed into the peak or off-peak bucket using the timestamp of the request that produced it, so a turn straddling a price boundary is not priced wholesale at the current window.
Embedded rate card (CNY per million tokens), verified 2026-09-10 against the official Models & Pricing page:
| Model | Bucket | Input (cache hit) | Input (cache miss) | Output |
|---|---|---|---|---|
deepseek-flash |
off-peak | 0.02 | 1 | 4 |
deepseek-flash |
peak | 0.04 | 2 | 8 |
deepseek-v4-pro |
off-peak | 0.15 | 4.5 | 13.5 |
deepseek-v4-pro |
peak | 0.30 | 9 | 27 |
The legacy ids deepseek-v4-flash and deepseek-v4-flash-vision-exp are
served by DeepSeek-V4.1-Flash and priced at the Flash rates;
deepseek-v4-pro is rerated to the Flash card from 2026-09-14 12:00 Beijing,
when that route is retired to V4.1-Flash. A model the card does not know is
reported as 费率未知 / unrated model — the plugin shows tokens instead of a
wrong number.
Balance. GET https://api.deepseek.com/user/balance (the same read-only
endpoint behind dsh-tui's /balance command). The key is resolved through the
credentials seam (DEEPSEEK_API_KEY) with an environment fallback, is sent
only in the request header, and is never logged or stored by this plugin.
Third-party providers
Since 0.4.0 the account section is no longer DeepSeek-specific. The plugin resolves, in order, which provider to ask, where it lives and how to ask it — and degrades quietly at every step it cannot complete:
- Provider — the focused conversation's last
request/header.config.provider(inautomode; the setting can pin one provider or turn the section off). A conversation restored at boot has published no header yet, soautothen uses the host's persisted/modelroute (~/.dsh-tui/model.json, the file the picker re-applies after a restart); the built-indeepseek-officialdefault is the last resort, for a host that persists no choice at all. - Endpoint and credential — the provider's own settings section (pointed at
by
ctx.llm.listConfigurableProviders()) → the spec file → the generated catalog snapshot. The key is resolved through thecredentialsseam with an environment fallback of the same name. - Adapter — by provider id, then by base-URL host, then by spec. Nothing
matches → the section is left off the line (it only says
no APIwhen you pinned that provider yourself).
Built-in adapters
| Adapter | Providers | Meters | Verified against a real account |
|---|---|---|---|
deepseek-balance |
deepseek-official / deepseek |
balance, in the reported currency | ✅ yes |
commandcode-plan |
commandcode |
5-hour and weekly windows, monthly plan remainder, period spend | ✅ yes (a live GOAT plan) |
openrouter |
openrouter |
balance (credits − usage), key limit, daily/weekly/monthly usage | ⚠️ no — built from the official docs, tested with fixture payloads |
moonshot-balance |
moonshotai / moonshotai-cn |
balance (CNY on .cn, USD internationally) |
⚠️ no |
siliconflow-balance |
siliconflow routes |
balance (the API states no currency, so none is printed) | ⚠️ no |
openai-billing |
gateways declared in the composition (One API, New API, self-hosted) | soft/hard_limit_usd (one grant, both fields equal) minus total_usage (cents); the unit follows the gateway's own display setting |
⚠️ no |
declared |
anything in the spec file | whatever the spec says | — |
OpenRouter's /credits requires a management key (an ordinary key is refused
with 403), so the adapter asks /key in parallel and still reports the key's
limit and usage when only an ordinary key exists.
Plans read as percentages
The shape of the account readout follows the provider's billing method: a
pay-as-you-go account (a currency balance, debited per token) shows amounts,
while a subscription (capped rolling windows over a monthly pool) shows
percentages — how much of the cap is left, and what share of it the turn just
drew. The order is: the Billing mode override, then the provider's own
declaration (an adapter, or a spec stanza's billing), then the data (capped
windows with no currency balance read as a plan). The inference is deliberately
conservative: an unrecognized shape reads as money — absolute figures — rather
than inventing a denominator.
Percentage base picks the denominator: the window the status line is
showing by default (the tightest limit — the one whose reset countdown is right
there), or the whole monthly pool. Each falls back to the other, so a provider
reporting only one of them still gets a usable divisor. No cap, no
percentage: the figure falls back to absolute amounts.
🌊 off-peak · weekend · peak in 18h26m · turn 1.79%(0.2500) · plan GOAT · 5h 92.9% left(1.00/14.00) · resets in 1h00m
A narrow terminal keeps the percentage and drops the rest. Every part may
carry a compact form (turn 1.79%); when the full line does not fit, the compact
forms are swapped in from the right, which is where the host truncates first. The
width comes from the host's terminal-size hook when there is one, then
process.stdout.columns; with neither, the line renders in full exactly as
before.
Precision follows magnitude: two decimals below 10% (a subscription turn is often
a fraction of a percent, where one decimal would look frozen), one at or above
it, <0.01% for anything smaller, and 0% for a true zero.
The spec file (providers with no adapter)
~/.dsh-tui/dsh-peak-balance-providers.json (safe to delete; a broken file reads
as an empty config):
{
  "version": 1,
  "apiBases": { "my-relay": "https://relay.example.com" },
  "allowUnofficial": false,
  "providers": {
    "my-relay": {
      "adapter": "declared",
      "auth": { "kind": "bearer", "apiKeyEnv": "MY_RELAY_KEY" },
      "requests": [
        {
          "path": "/api/user/self",
          "headers": { "New-Api-User": "1" },
          "meters": [
            { "id": "balance", "kind": "money", "currency": "USD", "value": "data.quota", "scale": 0.000002 },
            { "id": "periodSpend", "kind": "money", "currency": "USD", "used": "data.used_quota", "scale": 0.000002 }
          ]
        }
      ],
      "spendCounter": "data.used_quota",
      "spendUnit": { "kind": "money", "currency": "USD" }
    }
  }
}
Dot paths accept array indices (data.0.results.0.amount), scale converts
units, and resetAt understands ms / s / iso / remainingMs /
remainingS. The New API / One API account endpoint authenticates with a web
access token, not the sk- relay key, so store one separately (the
MY_RELAY_KEY above) and enable allowUnofficial — it is a console-side API.
Other recipes that need no code, only a spec stanza:
| Target | Fields that matter |
|---|---|
| Anthropic organization cost (admin key) | GET /v1/organizations/cost_report, amount at data.0.results.0.amount, unit is cents (scale: 0.01), currency USD |
| MiniMax coding plan | GET https://www.minimaxi.com/v1/api/openplatform/coding_plan/remains, model_remains.0.current_interval_usage_count / ..._total_count, reset via remains_time with resetUnit: "remainingMs" |
| 智谱 balance | GET https://open.bigmodel.cn/api/biz/account/query-customer-account-report, data.availableBalance (CNY) |
Compatibility
| Item | Value |
|---|---|
| Host | @deepseek-harness-tui/dsh-tui 0.10.x (ctx.tuiStatus.registerView, ctx.tuiSettingsSections.register, ctx.tuiScenes.register/open, ctx.commands.register, ctx.tuiCommandTrees.register, ctx.tuiShortcuts.register) |
| Harness | @deepseek-ai/dsh 0.1.2-rc.1 or later (session/event, settings, credentials) |
| Runtime | Node ^22.19 || >=24, pure ESM, no native dependencies (multi-frame zstd uses the built-in node:zlib) |
| Manifest | manifestVersion 0.15 · id com.dsh-tui-ecosystem.dsh-peak-balance · contracts tui.dsh/v1alpha1#DecisionEvents (optional) and commands.dsh/v1alpha1#Command (required) · four command contributions (/hist, /th, /tokenhistory, /quota) |
| Platform | Anywhere dsh-tui runs (Windows / macOS / Linux) |
Every host seam is optional and probed softly (ctx.get(name, false)): without
the TUI extension services, without a credentials service, or without network
access the plugin stays inert instead of failing the host. All registrations are
retried for 30 s while the profile composes, and every timer is cleared from the
activation's effect disposer.
The commands prefer the mediated surface (ctx.tuiPluginHost.registerCommand,
C-041 attribution plus the invoke checkpoint) and fall back to
ctx.commands.register (the documented C-070 boundary) when the host refuses it.
A third-party plugin loaded as a plain profile row has no verified component
identity, so the fallback is the path that actually answers here; when both fail
the plugin logs once and everything else keeps working. alt+h goes through
ctx.tuiShortcuts.register (ctrl/alt required, reserved combos refused with a
no-op disposer — alt+h collides with nothing).
Language. The plugin renders in the language dsh-TUI is showing, resolved in
the host's own order: DSH_TUI_LANG → the live dsh-tui.lang setting →
~/.dsh-tui/lang.json → the OS locale (an absent locale keeps the historical
zh, any other unsupported one falls back to en, matching dsh-TUI). A /lang
switch repaints the status line and an open history scene immediately through the
settings service's settings/updated(ns, next, prev, source) event; where that
namespace is not served, a 1 s poll of the persisted file (guarded by an
mtime/size stamp) picks the change up instead. DSH_PEAK_BALANCE_LANG_FILE
overrides the file path for tests and diagnostics.
Known limitations
- The prompt border itself cannot be recolored by a plugin. dsh-tui 0.10
draws the input frame in its own
EffortInputBordercomponent and exposes no seam for it, so the warning frame is a status contribution rendered directly above the prompt — the closest a plugin can get without patching the host. - Cost figures are estimates from provider-reported tokens; the platform bill is authoritative.
- The rate card is embedded in the package. A price change on DeepSeek's side
requires a plugin update; a model the card does not list needs
/hist price set. - The account section depends on the provider's own API: a provider with no public quota interface shows no figure at all (OpenAI, Gemini, Anthropic prepaid balance, the GLM/Kimi coding plans, Claude subscriptions), rather than a guessed one. A spec stanza can cover your own deployment or an interface this build does not ship.
- Before a restored conversation's first request, the account figure comes
from the host's
/modelroute, not from that conversation. dsh-tui emits no session event while it replays a restored session's history, so nothing has named that conversation's own provider yet; if the conversation is pinned to a different provider than the/modelchoice, its first request corrects the line. - Only the DeepSeek official and Command Code adapters were verified against a real account (see the table above). The other named adapters are implemented from each provider's own documentation and tested with fixture payloads drawn from it; they have not been checked against a live account.
- Undocumented endpoints are opt-in (
allowUnofficialQuota), because they can change without notice: a provider whose spec stanza (or the spec document) sets"allowUnofficial": trueis only queried while that global switch is on too. Command Code's/alpha/*routes are exempt: they are the ones the provider's own CLI drives. - No Command Code price card is embedded. Its model catalog carries no
prices and its pricing page is generated client-side, so an estimate would have
been invented; subscription models show tokens only until you set rates with
/hist price set commandcode:<model> …, while the per-turn figure stays the provider's own measured number. - Every
/histmoney figure is CNY. A cost comes from a rate card — the built-in table or your/th pricecustom rates — and both are denominated in CNY per million tokens, so the totals block, the per-provider subtotals and the model table all print¥.creditsdescribes an account's own meter on the status line; it is never a cost column. - The history cache is at version 2, so the first
/histafter upgrading rebuilds it from the session logs (a few seconds on this machine; the scan checkpoints as it goes). /quota's provider list merges the LLM seam's directory, the generated catalog snapshot and the spec file; a route declared in the composition but not currently routable may not appear.- The balance is shown in the currency the endpoint reports. The payload
carries
currency(CNY,USD, …), and the line uses the matching symbol (¥,$); an unknown currency falls back to its ISO code (12.34 CHF) instead of passing a dollar figure off as yuan. - Rich status contributions share a six-row budget with other plugins; this one requests three rows, and only while the warning frame is visible.
- The line follows the conversation the host reports as focused: switching
conversations moves it with you. A settled turn is remembered per
CONVERSATION, so leaving one and coming back still shows that conversation's
own last turn;
—appears only when the focused conversation has no settled turn in this process yet (a conversation just started with/new), never another conversation's figure. - Subagent spend counts toward the turn that spawned it. A child session's
usage is folded into the parent conversation's running turn via the
parentSessionin its session header; a background child that reports after the parent's turn closed no longer counts (that turn is settled). A host that names no parent keeps the old behaviour and ignores the child. Note that/histreports subagents separately (its own "count subagents" switch), so its grand total and the status line are not the same measurement by design. - An empty marker is a resting state, not a repeated
/new. The host writes~/.dsh-tui/resume.txtempty both on/newand when it exits a session it cannot resume, so the plugin applies that reading only when the file's content or mtime actually changes. Earlier versions re-applied it once per poll, which muted the conversation that owned the line — permanently, since the cleared-focus guard then skipped that conversation's own events. - Billing verdicts are fixed per request and per turn. A usage report is
filed under the tier its request STARTED in (
step/start), and a turn's rates and model come from its first report, so a mid-turn model switch or the 2026-09-14 Pro→Flash route change cannot reprice a whole turn retroactively. Settlement itself only matters for a turn that recorded no report at all. - A bare
/th+ Enter is captured by the host's completion overlay (see "Why a bare /th + Enter switches the theme"): the plugin cannot move its own entry to the front of that list. Use/hist,/tokenhistory,alt+h, or/thwith a trailing space. A future skill starting withhistwould capture/histthe same way. - The history covers only this machine's dsh usage. Calls made elsewhere (web chat, other clients, other machines) are not in these logs, and the earliest covered day is whatever the local logs still hold.
- The first
/thon a machine with no cache needs a few seconds for the full scan (437 logs / ~112 MB here ≈ 5–6 s, of which ≈ 4.3 s is the frame-by-frame zstd decode) and shows progress while it runs; the scan checkpoints as it goes, so an interrupted first run resumes, and it paints as it goes, newest logs first, so the recent weeks appear within the first second. Once the cache exists, opening the scene answers from it immediately. A cache written by an older plugin version is migrated rather than rebuilt; only a version with no migration path is discarded and rescanned. - A freshly forked log that still has exactly two frames cannot be continued
from its cached prefix. Its first frame is the session header and its second
is the
session/end-seedcut marker, so a prefix that holds only the header does not say where the fork cut is; the plugin re-reads such a log whole (a cost measured in hundreds of bytes). - Mouse hover needs the full-screen (alternate screen) layout — the profile
ships
fullscreen: true. In inline mode the keyboard (←/→/↑/↓) selects days and shows the same detail card. - Square shading uses quartiles of the non-zero days in the visible span, so a value's color bucket can shift as history grows (GitHub behaves the same); the legend always states the current maximum.
- A terminal that is too narrow trims weeks instead of shrinking squares. The
title chip says
showing 27/53w, and←/→scroll the window one column at a time so the selection is never hidden. Too few rows degrade in priority order: the model table, then the detail card's fields (models first, then hit-rate / cost / tokens), then the totals row. Under 12 rows or 40 columns the scene switches to a fallback list (one recent day per line plus a totals line) so nothing ever overflows.
Publishing and versioning
Released from VviLliAm-qwq/dsh-peak-balance
under MIT. Versions follow
SemVer; the npm version and the manifest version are kept identical, and a
v* tag matching the version drives the release workflow. That workflow
publishes through npm trusted publishing (OIDC), so the repository stores no
token.
Development
pnpm install --frozen-lockfile
pnpm check:encoding      # no UTF-8 BOM / damaged sequences (the classic dsh crash)
pnpm validate:manifest   # admission shape + version agreement
pnpm test                # node:test unit + host-stub integration tests
pnpm pack:verify         # every module the entry imports ships in "files"
pnpm verify              # all four, in order
The tests cover the peak-window maths at fixed instants, the rate card and
bucket pricing, usage normalization, balance-payload parsing (including
failures), the display model, the status component's element tree, a full
apply() run against a stubbed Cordis context — including the paths where the
host services are missing, refuse, or throw — and the whole history stack: day
and week arithmetic, fork-seed cutting, the view model, the incremental scanner
(multi-frame zstd, damaged and truncated frames, cache reuse), the custom-rate
file, the /th price grammar and the scene's element tree.
Host-integration probe (boots a throwaway profile headlessly and checks whether the host accepts the registrations — the layer unit tests cannot see):
node ../../tools/probe-plugin.mjs . --wait 15
The probe profile now mounts the scenes, plugin-host, command-trees and
extensions (which carries tuiShortcuts) rows too, so the scene, the four
commands and the alt+h shortcut are verified as well; a passing run logs
history scene registered, four command registered lines,
command tree registered roots=4 and shortcut registered alt+h, and exits 0.
Verifying the history numbers
The aggregation is pure and unit tested, but the data needs real logs. To double-check on the same machine:
- delete
~/.dsh-tui/dsh-peak-balance-history.jsonso the next/threscans everything; - fold the same bytes with an independent implementation (one that does not import this package) and compare the per-day and per-model figures;
- remember the logs are live files: totals grow while the tool runs, so two snapshots never match — only agreement on the same batch of bytes means anything.
That is how this release was checked: 341 logs, 116 (model, day, tier) buckets,
zero disagreements between the two implementations, plus zero duplicate seq
numbers, zero out-of-order seq numbers and zero malformed JSONL lines.
Previewing the peak-hour warning
The warning frame only appears inside a real peak window (Mon-Fri
09:00-12:00 / 14:00-18:00 Beijing). To preview it at any hour:
DSH_PEAK_BALANCE_FORCE_PEAK=1 dsh --profile dsh-tui # PowerShell: $env:DSH_PEAK_BALANCE_FORCE_PEAK=1
The override changes presentation only — the countdown still describes the real
clock — and it is off unless the variable is set to 1/true/yes/on.
Diagnostics
The plugin keeps a bounded lifecycle log at ~/.dsh-tui/dsh-peak-balance.log:
one line when the module is imported, one when apply() starts (with pid and
the file path it was loaded from), the resolved config, which host seams were
mountable, the outcome of every registration, and teardown. That is enough to
tell "the host never loaded the file" apart from "a seam refused" without
attaching a debugger to a running TUI. The file trims itself to its newest half
once it passes 128 KiB, and DSH_TUI_DEBUG=1 adds the per-refresh detail. Test
runs never touch it.
The focused conversation comes from two independent sources, in this order:
- the host-mediated
tui/session-switchedDecisionEvents notification, used when the host mounts its plugin-interop row (host=1in the log). The manifest requires that contract as optional with its fallback spelled out, so a host without it degrades instead of refusing admission; - the launcher marker the host rewrites on every switch
(
~/.dsh-tui/resume.txt), polled once a second. The host EMPTIES that marker to start a fresh conversation (/new) — a statement rather than silence: the line gives up the figure you were reading, and the first conversation that is not the one left behind claims it. Only a marker that cannot be read at all falls back to the most recent session event.
DSH_PEAK_BALANCE_FOCUS_FILE overrides the marker path — meant for tests and
diagnostics, so a test run never reads a real marker.
Notes for plugin authors
Host behaviours that cost real debugging time here, and are easy to hit:
- A Cordis entry must export only
name,Configandapply. Exporting helpers from the same module changes how the loader wraps the activation, and everytuiStatus/tuiSettingsSectionsregistration from that activation is then rejected withrequires a live Cordis activation context. The failure is partial and quiet: the settings namespace still registers, so the plugin looks half-alive while the settings card and the status line never appear. Keep the implementation in a sibling module and re-export the three symbols. - Resolve optional host services strictly first (
ctx.get(name)); the non-strictctx.get(name, false)can hand back a shadow placeholder whose method calls the host refuses. Keep the non-strict form only as a fallback, and keep retrying — the seam rows may still be activating on the first tick. - Mediated command registration needs a verified component identity, which a
plain profile row never gets:
ctx.tuiPluginHost.registerCommandthrowsthe calling activation has no verified dsh-plugin.json Component identity. Declarecommands.dsh/v1alpha1#Commandand the contribution id honestly in the manifest anyway, but be ready to fall back toctx.commands.register— without it the command silently disappears. - A plugin command name must not be a prefix of a built-in command. The
slash-completion overlay owns Enter while it is open and runs the HIGHLIGHTED
suggestion, and built-ins come first in the merged list — so
/thloses Enter to/theme. Pick a non-colliding name (/hist) or bind a shortcut (ctx.tuiShortcuts; ctrl/alt required, reserved combos refused). - Scene hooks must be called unconditionally and in a stable order. A
well-meaning "only call
ui.useThemeif it exists" changes the hook order and real React throws an invalid-hook-call. Read the hooks out first (with default-returning stubs) and call them every render. - A full-screen scene must budget its own rows and columns. In the alternate screen an overflow does not get clipped — it pushes the whole frame. Ask "how many rows are left" before drawing each section, and compute the columns you can actually fit instead of hoping the host truncates.
This plugin writes what it learned to ~/.dsh-tui/dsh-peak-balance.log, which
is how these were found; see Diagnostics above.
Listing
This plugin is listed on the dsh-tui plugin market. Market listings are a link directory only; they are not a code review and do not imply endorsement.
License
MIT — see LICENSE.
Related相关推荐
-
 MeteorNOX/DeepSeek-Balance-Whale-Widget
DeepSeek Harness(DSH)一只住在 DSH 界面右下角的小鲸鱼娘,帮你盯着DeepSeek账户余额。QQ弹弹,支持拖拽吸附、左吸附翻转、数字滚动动画,随界面自动启用,建议直接喊来你的dsh安装
MeteorNOX/DeepSeek-Balance-Whale-Widget
DeepSeek Harness(DSH)一只住在 DSH 界面右下角的小鲸鱼娘,帮你盯着DeepSeek账户余额。QQ弹弹,支持拖拽吸附、左吸附翻转、数字滚动动画,随界面自动启用,建议直接喊来你的dsh安装
-
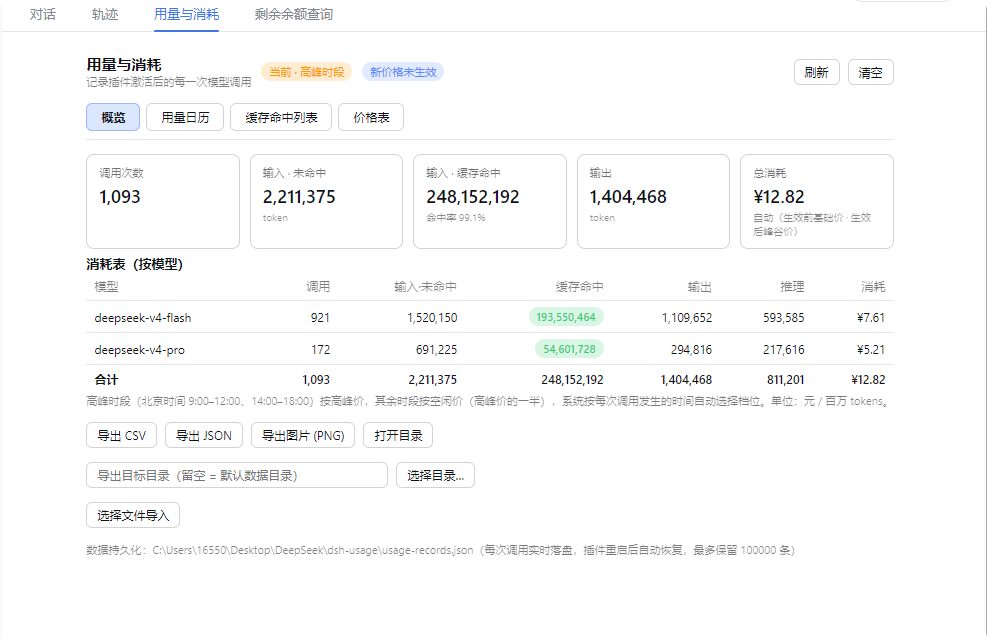 feiyang-dev/dsh-usage-plugin
DeepSeek Harness 用量与消耗插件(dsh-usage-plugin)—— 每次调用的 token 用量/缓存命中统计、峰谷计费、余额查询、CSV/JSON/PNG 导出,可经桌面端一键安装或命令行 dsh plugin ad…
feiyang-dev/dsh-usage-plugin
DeepSeek Harness 用量与消耗插件(dsh-usage-plugin)—— 每次调用的 token 用量/缓存命中统计、峰谷计费、余额查询、CSV/JSON/PNG 导出,可经桌面端一键安装或命令行 dsh plugin ad…
-
 Lxiayu/DshCockpit
Desktop cockpit for DeepSeek Harness (dsh): token usage & cost tracking, budget alerts, runtime auto-update with rollbac…
Lxiayu/DshCockpit
Desktop cockpit for DeepSeek Harness (dsh): token usage & cost tracking, budget alerts, runtime auto-update with rollbac…
-
 Witherwithwinter/DeepSeek-Balance-Whale-Widget-Bowl
DeepSeek Harness(DSH)Web 界面右下角的常驻余额挂件。基于 MeteorNOX/DeepSeek-Balance-Whale-Widget 修改的铁盆鲸鱼娘版。
Witherwithwinter/DeepSeek-Balance-Whale-Widget-Bowl
DeepSeek Harness(DSH)Web 界面右下角的常驻余额挂件。基于 MeteorNOX/DeepSeek-Balance-Whale-Widget 修改的铁盆鲸鱼娘版。
-
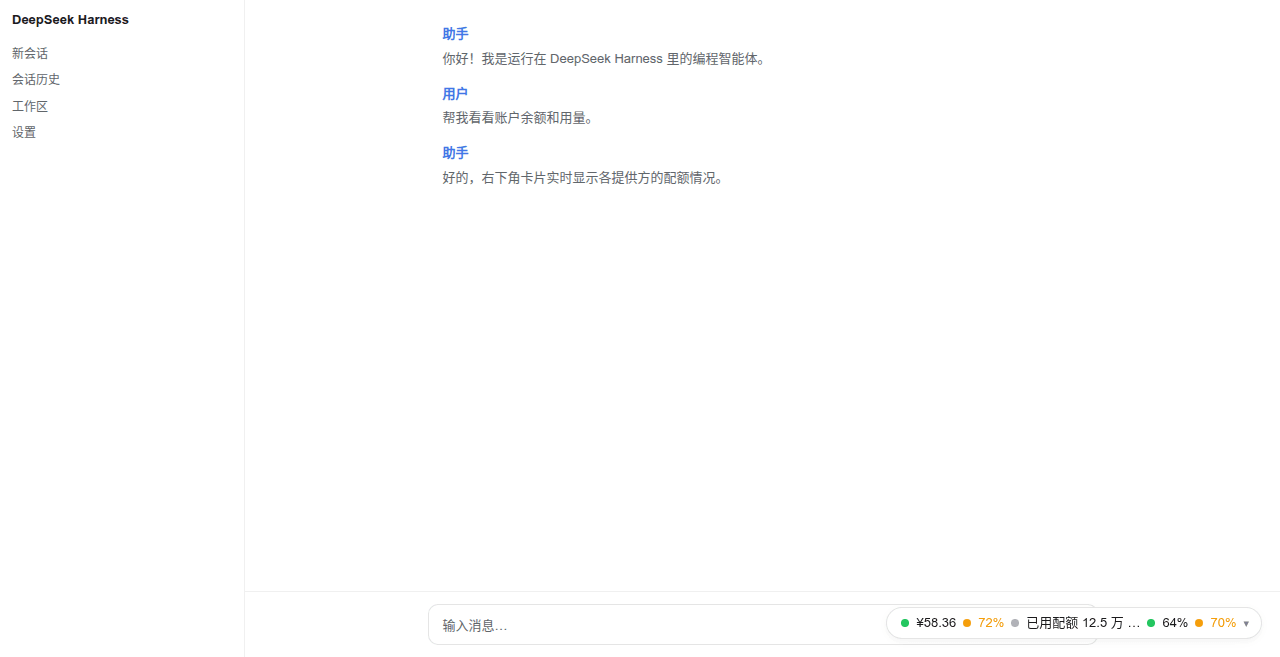 wenzetan/dsh-quota-panel
Provider quota/balance widget for the dsh web surface: capsule + card + settings panel, dual-face (loopback RPC host hal…
wenzetan/dsh-quota-panel
Provider quota/balance widget for the dsh web surface: capsule + card + settings panel, dual-face (loopback RPC host hal…
-
 nonewind/dsh-spend
Token usage & cost monitor for DeepSeek Harness — floating widget with multi-dimensional stats, time-series charts, auto…
nonewind/dsh-spend
Token usage & cost monitor for DeepSeek Harness — floating widget with multi-dimensional stats, time-series charts, auto…
-
 lssyd20070106/dsh-ui-preset-enhance
Third-party DSH WebUI enhancement plugin: custom backgrounds, theme colors, prompt presets, token/context visibility, an…
lssyd20070106/dsh-ui-preset-enhance
Third-party DSH WebUI enhancement plugin: custom backgrounds, theme colors, prompt presets, token/context visibility, an…
- PerryLink/dsh-observe OpenTelemetry and Langfuse observability exporter for DeepSeek Harness: turn/step/tool/LLM spans, token and cost metrics…