NOirBRight/dsh-usage-monitor
DeepSeek Harness 的会话日志使用仪表板
Project Overview项目介绍
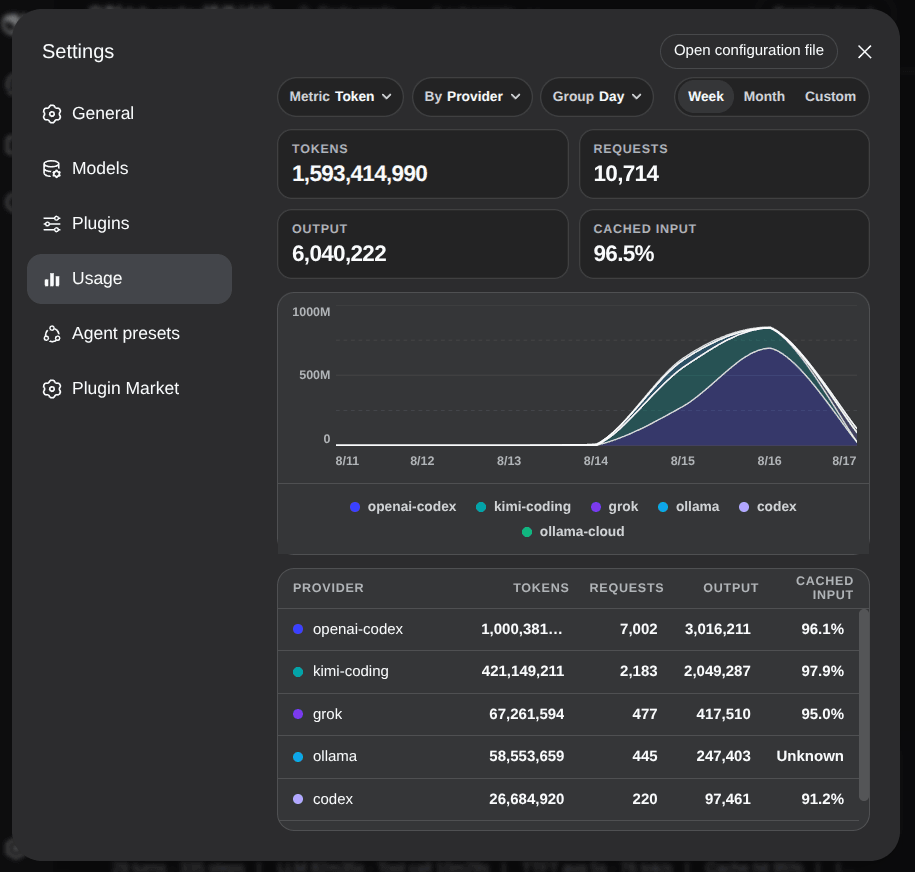
dsh-usage-monitor is a usage dashboard plugin for DeepSeek Harness. It extracts token, request, output, and cache-hit metrics from session logs and renders them as tiles, a stacked chart, and a provider table in Settings → Usage, with day/week/custom ranges and grouping by provider, model, or workspace. Use it to analyze consumption patterns across sessions. Note: subscription quotas are not fetched.
dsh-usage-monitor 是 DeepSeek Harness 的用量仪表盘插件。它从会话日志中提取 token、请求、缓存命中率等数据,在“设置→用量”中以堆叠图表和分组表格展示,适用于需要按日/周或自定义范围跨 provider、模型、工作区分析消耗的场景。注意:订阅配额不会拉取。
请帮我了解并安装插件:【dsh-usage-monitor】【https://github.com/NOirBRight/dsh-usage-monitor】Send this message to DSH in your current session. CLI install commands may not be accurate across systems — DSH will figure it out for you.把上面这条消息直接发给当前会话里的 DSH,让它帮你了解并安装。安装命令不一定准确,发给 DSH 更稳。
Or use CLI install (for developers)或使用命令行安装(适合开发者)
CLI Install命令行安装
dsh plugin --profile web add --force https://github.com/NOirBRight/dsh-usage-monitor/releases/latest/download/dsh-usage-monitor-0.2.14.tgz把 NOirBRight/dsh-usage-monitor 加入你的 DSH 配置(web profile)即可启用。
READMEREADME
dsh-usage-monitor
English | 中文
Usage dashboard for DeepSeek Harness. It folds provider-reported token usage out of session logs and charts it in Settings.
Compatibility
Host @deepseek-ai/dsh-* packages are not version-locked: peers are * and optional. devDependencies pin the compile target (0.1.5-rc.1). Cordis stays >=4.0.2 <5.0.0.
Verified Hosts in package.json#dsh.compatibility.dshReleases are evidence, not an allowlist. Unknown newer Hosts warn once and keep the normal mount path. Only a reproduced failure is blocklisted.
What it shows
- Tokens, requests, output tokens, and cache-hit rate
- Stacked chart with Metric (token / request), By (provider / model / workspace), Group (day / week)
- Week, month, and custom ranges
- A responsive overview with a full-width token summary, compact secondary metrics, a stacked chart, and token-share cards that follow the current By grouping
- On narrow screens, the cards collapse to one column and the chart legend scrolls horizontally
Subscription quotas are not fetched.
Installation
Host DSH packages are not version-locked; see Compatibility. Install from GitHub:
dsh plugin --profile web add --force https://github.com/NOirBRight/dsh-usage-monitor/releases/latest/download/dsh-usage-monitor-0.2.14.tgz
dsh web
The repository tracks release-ready lib artifacts, so GitHub installation needs no build-script allowlist. A source checkout can use a link installation after running pnpm run build.
Then open Settings → Usage.
Data
Reads ctx.sessionQuery (live + persisted sessions). Cold folds prefer the JSONL backend's resolveCurrentLog artifact as raw JSONL so Host-unknown event types still contribute usage; the plugin does not invent session directory layout and does not read leftover community cache files. A session that cannot be read at all is omitted from the snapshot; the page still shows the remaining complete rows.
Release
pnpm run check runs the full gate in order: unit tests, TypeScript typecheck, deterministic build-parity (clean temp build vs tracked lib/), package build, and a real npm pack + immutable fixtures/rc1 validation + offline install + Host/client import smoke. The pack check reads only the repository-owned 0.1.5-rc.1 manifest/tarballs, verifies the official 0.1.5-rc.1 tag/commit and registry integrity, preserves versioned parent edges, and uses a fresh pnpm consumer with an invalid registry, offline/no-scripts/no-audit/no-fund settings, empty NODE_PATH, and scoped local-tarball overrides; it uses neither --legacy-peer-deps nor omit/force bypasses. The owner archive is written only below the prefixed temporary directory. It does not rewrite lib/ before comparison, so a stale, missing or hand-edited artifact fails.
For a tag, run pnpm run check:strict (the same test, typecheck, parity, build, and pack order with PARITY_CHECK_HEAD=1; it fails if the committed lib/ still differs from the source — the v0.2.5 drift guard). Keep src as the source of truth and commit the rebuilt lib/.
The Settings → Usage nav icon is a DOM patch via ctx.effect + MutationObserver on document.body; see src/client/nav-icon.ts for the ctx.effect disposer and the accepted Alpha.4 DOM risk.
Release installation (Latest)
Session-log usage dashboard with responsive metric cards, charting, and provider shares. The published pack contains built Host/Client files only; it has no sibling-repository source, workstation path, link:, or workspace: dependency. Pack-check fixtures and compile-target devDependencies are 0.1.5-rc.1.
Latest installation (the URL never contains a version):
dsh plugin --profile web add --force \
  https://github.com/NOirBRight/dsh-usage-monitor/releases/latest/download/dsh-usage-monitor-0.2.14.tgz
Fixed-version installation:
dsh plugin --profile web add --force \
  https://github.com/NOirBRight/dsh-usage-monitor/releases/download/v0.2.14/dsh-usage-monitor-0.2.14.tgz
Update, uninstall, and verify:
# Update to the latest Release
dsh plugin --profile web add --force \
  https://github.com/NOirBRight/dsh-usage-monitor/releases/latest/download/dsh-usage-monitor-0.2.14.tgz
# Verify the loaded version
dsh plugin --profile web list
dsh plugin --profile web doctor
# Uninstall only this plugin
dsh plugin --profile web remove dsh-usage-monitor
Configuration: use the plugin section in Settings for Web UI plugins, or the profile dsh.profile.bundles entry for Host-only plugins. Start with this README's minimal YAML/JSON example and provide credentials/backend addresses explicitly.
Rollback: rerun the fixed v0.2.14 command, verify the profile list, then restart the Web service once. Inspect journalctl --user -u dsh-web.service and dsh plugin --profile web doctor; never put a source checkout in the production profile.
Release and integrity: v0.2.14 · SHA256SUMS.
Related相关推荐
-
 wssfk12138/dsh-damage-pulse
DeepSeek Harness Token 余额监控插件:鲸鱼娘待机/扣费/复苏动画、峰谷计费、连续扣费飘字与会话费用统计。
wssfk12138/dsh-damage-pulse
DeepSeek Harness Token 余额监控插件:鲸鱼娘待机/扣费/复苏动画、峰谷计费、连续扣费飘字与会话费用统计。
-
 songoao25/dsh-bottom-info-bar
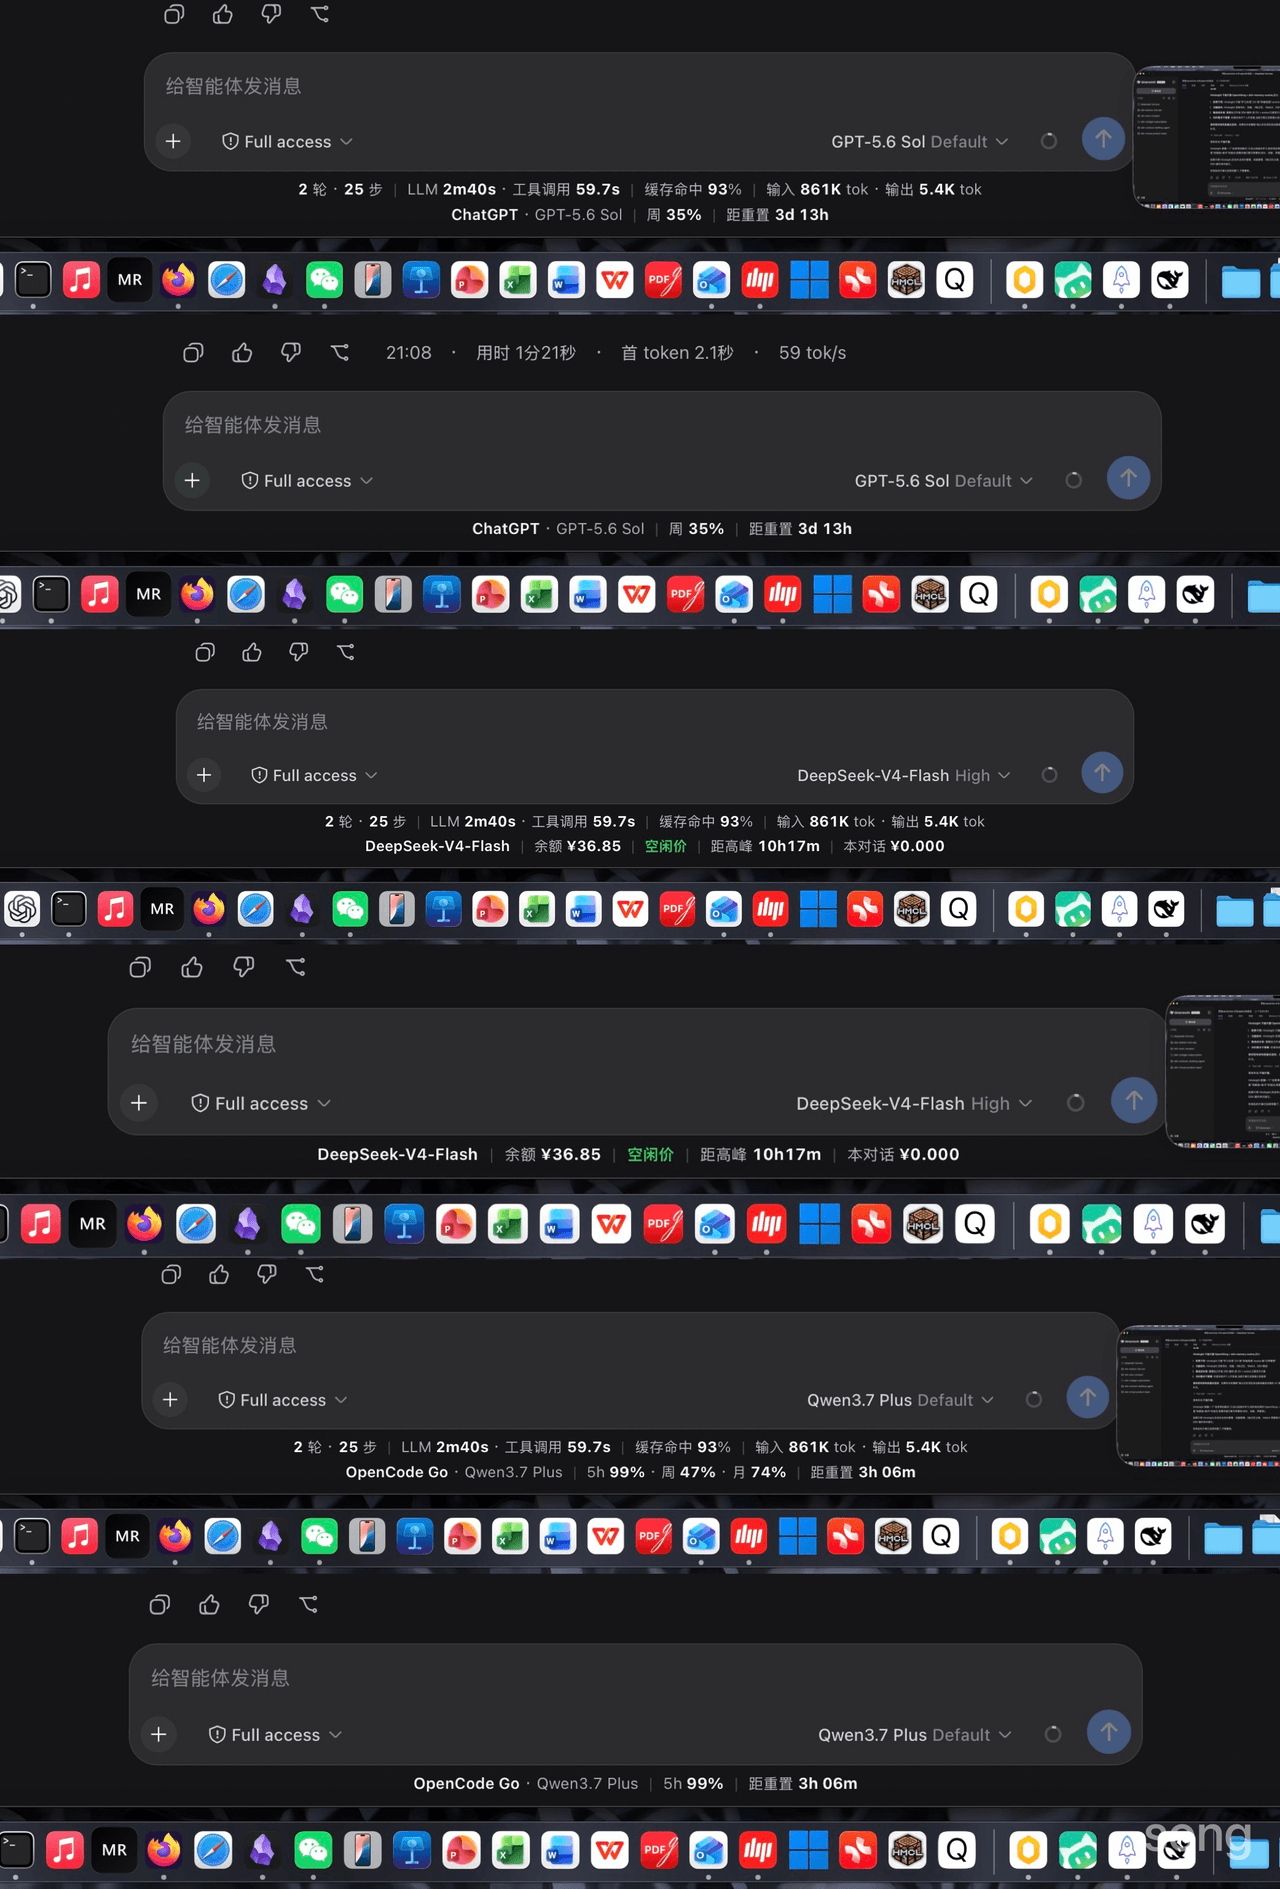
Bottom Info Bar — an information bar plugin for DeepSeek Harness: provider/model, live balance, peak/off-peak pricing wi…
songoao25/dsh-bottom-info-bar
Bottom Info Bar — an information bar plugin for DeepSeek Harness: provider/model, live balance, peak/off-peak pricing wi…
-
 Rianico/dsh-better-edit
Hash-anchored read/edit/undo_last_edit tools for DeepSeek Harness (dsh), fewer token consumption, lower cost.
Rianico/dsh-better-edit
Hash-anchored read/edit/undo_last_edit tools for DeepSeek Harness (dsh), fewer token consumption, lower cost.
-
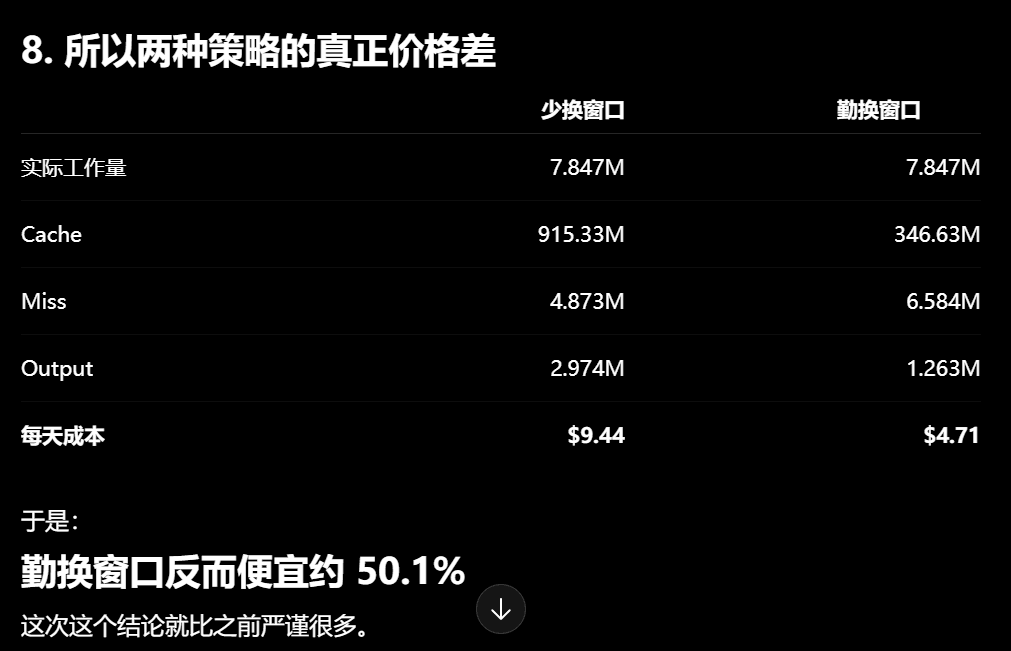 Phant0Meow/dsh-meow-cachebilling
一个能帮你省钱的插件!缓存其实比你想象的贵!换窗口可以省缓存钱,但换窗口有顾虑,或许你懒得重新描述项目和规则,或者你还需要那个上下文。所以这个插件,就是为了告诉你,当前轮,纯粹上下文缓存的部分,到底花了你多少钱。这样你才心里有个底,判断什么…
Phant0Meow/dsh-meow-cachebilling
一个能帮你省钱的插件!缓存其实比你想象的贵!换窗口可以省缓存钱,但换窗口有顾虑,或许你懒得重新描述项目和规则,或者你还需要那个上下文。所以这个插件,就是为了告诉你,当前轮,纯粹上下文缓存的部分,到底花了你多少钱。这样你才心里有个底,判断什么…
-
 Ghost011118/dsh-balance-meter
DeepSeek account balance and session cost readout for the DeepSeek Harness Web GUI
Ghost011118/dsh-balance-meter
DeepSeek account balance and session cost readout for the DeepSeek Harness Web GUI
-
 ai-shushu/dsh-quota-meter
Per-session quota meter for DSH: real-token billing, live progress bar, budget blocking, configurable multi-model pricin…
ai-shushu/dsh-quota-meter
Per-session quota meter for DSH: real-token billing, live progress bar, budget blocking, configurable multi-model pricin…
-
 TwotwoPiggy/dsh-balance
dsh余额插件. A DeepSeek Harness plugin for real-time token tracking and highly accurate session cost estimation, featuring d…
TwotwoPiggy/dsh-balance
dsh余额插件. A DeepSeek Harness plugin for real-time token tracking and highly accurate session cost estimation, featuring d…
-
 GooodWei/context-vista
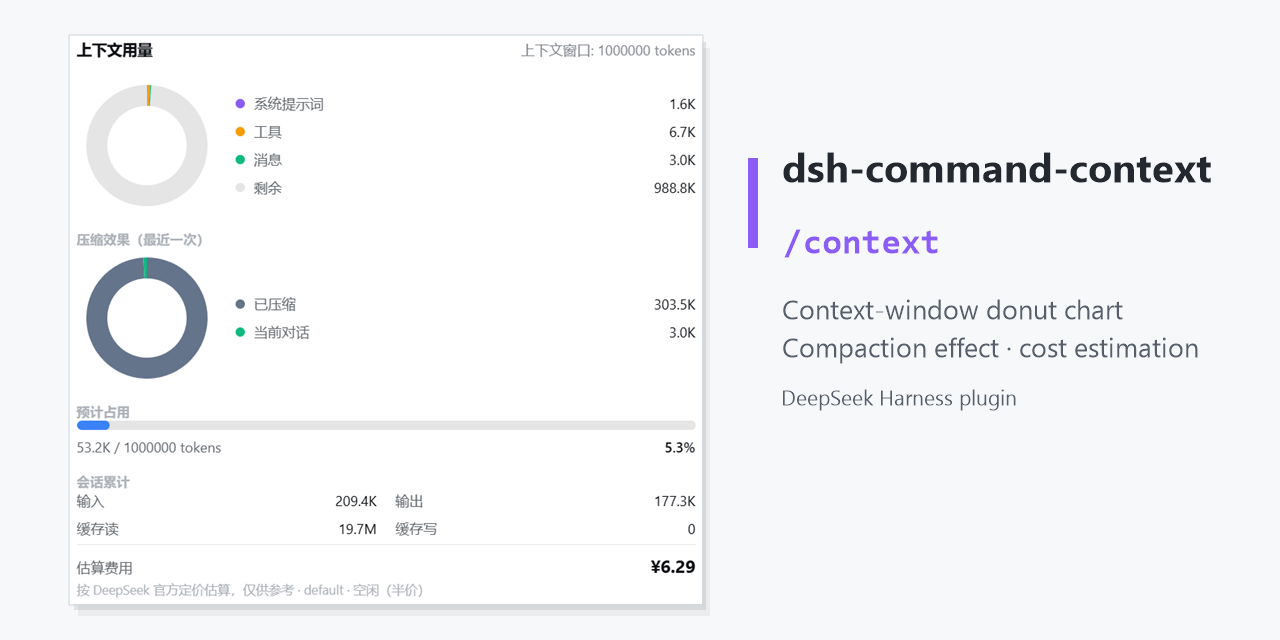
为 DeepSeek Harness 提供右侧悬浮栏以及 /context 命令,用环形图实时展示当前上下文 token 用量与分配,compact指令效果,同时支持估算费用消耗,对标 Claude Code 的 /context。
GooodWei/context-vista
为 DeepSeek Harness 提供右侧悬浮栏以及 /context 命令,用环形图实时展示当前上下文 token 用量与分配,compact指令效果,同时支持估算费用消耗,对标 Claude Code 的 /context。